At its core, sieve analysis is a straightforward and widely used technique for determining the particle size distribution of a granular material. The method works by passing a sample through a stack of sieves with progressively smaller mesh openings and then weighing the amount of material retained on each sieve. This process effectively sorts the particles by size.
Sieve analysis provides a cost-effective and robust method for measuring particle size, but its results are most meaningful for relatively spherical particles within a specific size range. Understanding its operational principles and limitations is critical for accurate interpretation.
The Fundamental Principle: How Sieve Analysis Works
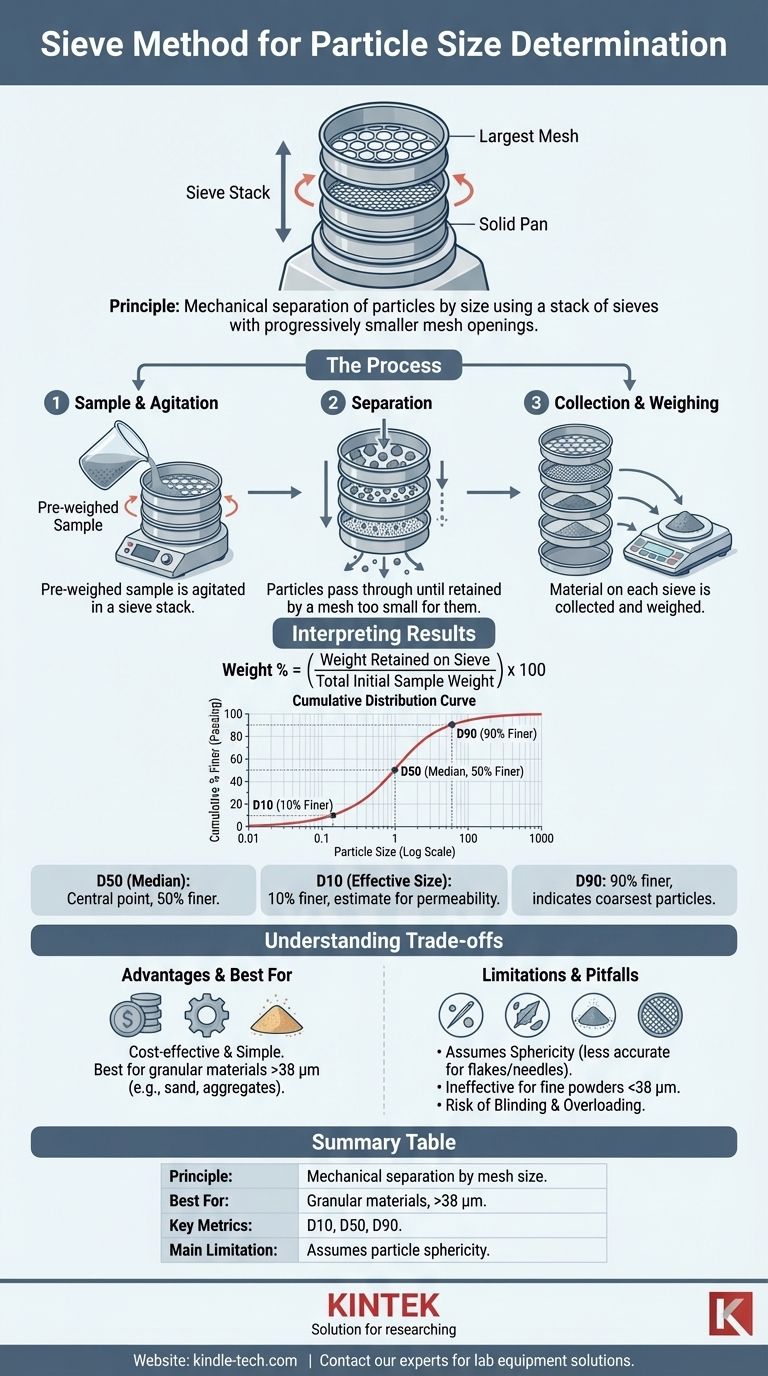
Sieve analysis, also known as a gradation test, operates on the simple mechanical principle of separation. A pre-weighed sample is subjected to agitation, allowing particles to pass through a series of screens until they are retained by a mesh that is too small for them to pass through.
The Sieve Stack: A Hierarchy of Meshes
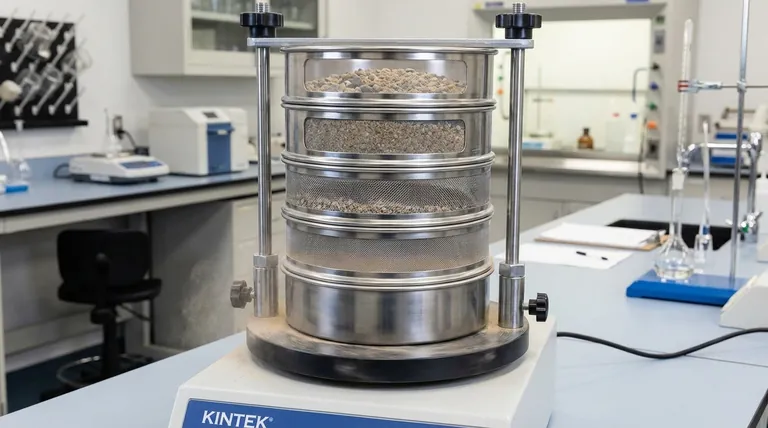
The primary tool is the sieve stack, a column of nested sieves. The sieve at the top has the largest mesh openings, and each subsequent sieve down the stack has progressively smaller openings. A solid pan is placed at the very bottom to collect the finest particles.
Each sieve is a wire mesh screen or a perforated plate with uniform apertures of a specific size. The size of these openings, known as the mesh size, is standardized.
The Agitation Process: Ensuring Particle Passage
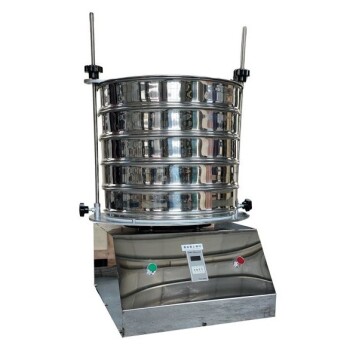
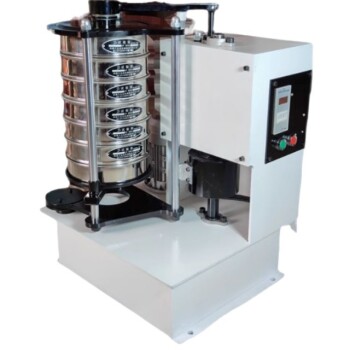
Simply placing material on a sieve is not enough. The entire sieve stack is placed in a mechanical shaker. This device agates the stack, typically with a combination of vertical tapping and horizontal circular motion.
This movement serves two purposes: it breaks apart any agglomerated clumps and gives each particle multiple opportunities to find an opening it can pass through. The duration and intensity of the shaking are critical parameters that must be standardized for repeatable results.
The Measurement: Weighing the Retained Fractions
After the shaking is complete, the stack is disassembled. The material retained on each individual sieve is carefully collected and weighed. The sum of the weights on each sieve plus the weight in the bottom pan should be very close to the initial sample weight.
This collection of weights forms the raw data for the particle size distribution analysis.
Interpreting the Results: From Raw Data to Distribution
The raw weight data is converted into a particle size distribution, which provides a comprehensive view of the material's granular structure.
Calculating Weight Percentage
For each sieve, the weight of the retained material is expressed as a percentage of the total initial sample weight. This gives you the percentage of particles that fall within the size range between that sieve and the one directly above it.
The Cumulative Distribution Curve
The most common way to report results is with a cumulative distribution curve. This graph plots the particle size (on the x-axis, typically logarithmic) against the cumulative percentage of particles that are smaller than that size (on the y-axis).
This "percent passing" or "percent finer" curve provides an immediate visual summary of the material's gradation, showing whether it is coarse, fine, or well-graded (containing a wide range of sizes).
Key Metrics: D10, D50, and D90
From the cumulative curve, several key metrics are extracted to summarize the distribution with single numbers:
- D50 (Median): The particle size at which 50% of the sample (by weight) is smaller. It represents the central point of the distribution.
- D10 (Effective Size): The particle size at which 10% of the sample is smaller. This is often used in geotechnical engineering to estimate hydraulic conductivity.
- D90: The particle size at which 90% of the sample is smaller. This value indicates the size of the coarsest particles in the sample.
Understanding the Trade-offs
While powerful, sieve analysis is not a universal solution. Its utility is defined by clear advantages and significant limitations.
Key Advantages: Simplicity and Cost-Effectiveness
Sieve analysis is one of the most inexpensive and easy-to-perform methods for particle sizing. The equipment is robust, the procedure is straightforward, and it provides reliable data for many quality control applications, especially in industries like construction aggregates, mining, and food production.
Major Limitation: The Assumption of Sphericity
A critical weakness is that sieving does not measure a particle's true diameter. A long, needle-shaped particle can pass through a mesh opening end-on, so its "sieve diameter" corresponds to its second-largest dimension, not its longest.
This means for non-spherical particles (e.g., flakes, needles, or rods), the results can be misleading if not interpreted with caution. Sieving is best suited for particles that are roughly equiaxed or spherical.
The Practical Size Range
Sieving is most effective for particles larger than approximately 38 micrometers (μm), corresponding to a No. 400 mesh sieve. Below this size, electrostatic and cohesive forces cause fine particles to clump together, preventing them from passing through the mesh effectively.
For finer powders and nano-materials, alternative methods like laser diffraction or dynamic light scattering (DLS) are required.
Common Pitfalls: Blinding and Overloading
Two common operational errors can invalidate results:
- Sieve Blinding: Occurs when particles become lodged in the mesh openings, blocking other particles from passing. This is common with near-size particles.
- Sieve Overloading: Happens when too much sample is placed on a sieve, preventing particles from having a chance to reach the mesh surface.
Making the Right Choice for Your Application
Choosing the right particle analysis method depends entirely on your material and your goal.
- If your primary focus is routine quality control for coarse, granular materials (e.g., sand, grain, plastic pellets): Sieve analysis is an excellent, cost-effective, and reliable choice.
- If your primary focus is analyzing fine powders, pigments, or emulsions (below ~40 µm): You must use an alternative method like laser diffraction for accurate results.
- If your primary focus is understanding the true shape and size of non-spherical particles: Sieve analysis should be supplemented with a shape-sensitive technique like automated image analysis or microscopy.
Ultimately, understanding the fundamental principles and inherent limitations of sieve analysis is the key to generating data you can trust.
Summary Table:
| Aspect | Description |
|---|---|
| Principle | Mechanical separation of particles by size using a stack of sieves with progressively smaller mesh openings. |
| Best For | Granular materials with relatively spherical particles, typically larger than 38 µm (e.g., sand, aggregates, grains). |
| Key Metrics | D10, D50 (median), D90 - particle sizes at which 10%, 50%, and 90% of the sample is finer. |
| Main Limitation | Assumes particle sphericity; less accurate for flakes, needles, or very fine powders (< 38 µm). |
Need precise particle size data for your materials?
KINTEK specializes in high-quality lab equipment, including robust sieve shakers and test sieves, to ensure your particle analysis is accurate and repeatable. Whether you're in quality control for construction materials, mining, or food production, our solutions are designed for reliability and ease of use.
Let us help you achieve trusted results. Contact our experts today to discuss the ideal particle sizing solution for your laboratory's specific needs.
Visual Guide
Related Products
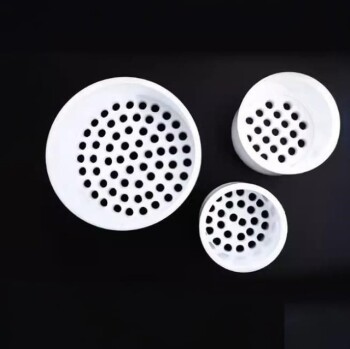
- Custom PTFE Teflon Parts Manufacturer for PTFE Mesh F4 Sieve
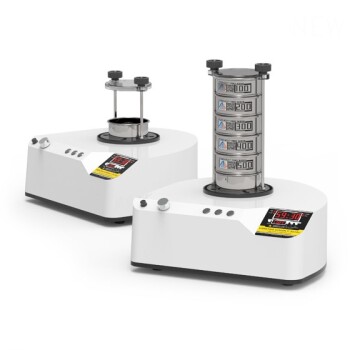
- Laboratory Test Sieves and Sieving Machines
- Laboratory Vibratory Sieve Shaker Machine Slap Vibrating Sieve
- Three-dimensional electromagnetic sieving instrument
- 10L Chilling Circulator Cooling Water Bath Low Temperature Constant Temperature Reaction Bath
People Also Ask
- What is the difference between ASTM standards sieves and is standard sieves? Ensure Compliance for Your Lab
- What are the specifications for test sieves? A Guide to ASTM & ISO Standards for Accurate Particle Analysis
- What is the mesh size of a sieve? A Guide to Particle Size and Sieve Selection
- What are the primary reasons for selecting PTFE as a matrix? Enhance Composites with Carbon Nanotube Reinforcement
- Is PTFE corrosion resistant? Discover the Ultimate Chemical Resistance for Your Lab