To measure particle size with sieves, you create a stack of sieves with progressively smaller mesh openings from top to bottom, place a pre-weighed, dry sample on the top sieve, and agitate the entire stack. This allows particles to fall through the apertures until they are retained by a sieve mesh they cannot pass. The final step is to weigh the material retained on each individual sieve to determine the particle size distribution of the original sample.
Sieve analysis does not measure the size of a single particle. Instead, it is a bulk analysis method that separates a material into different size fractions, allowing you to understand the overall distribution of particle sizes within a sample.
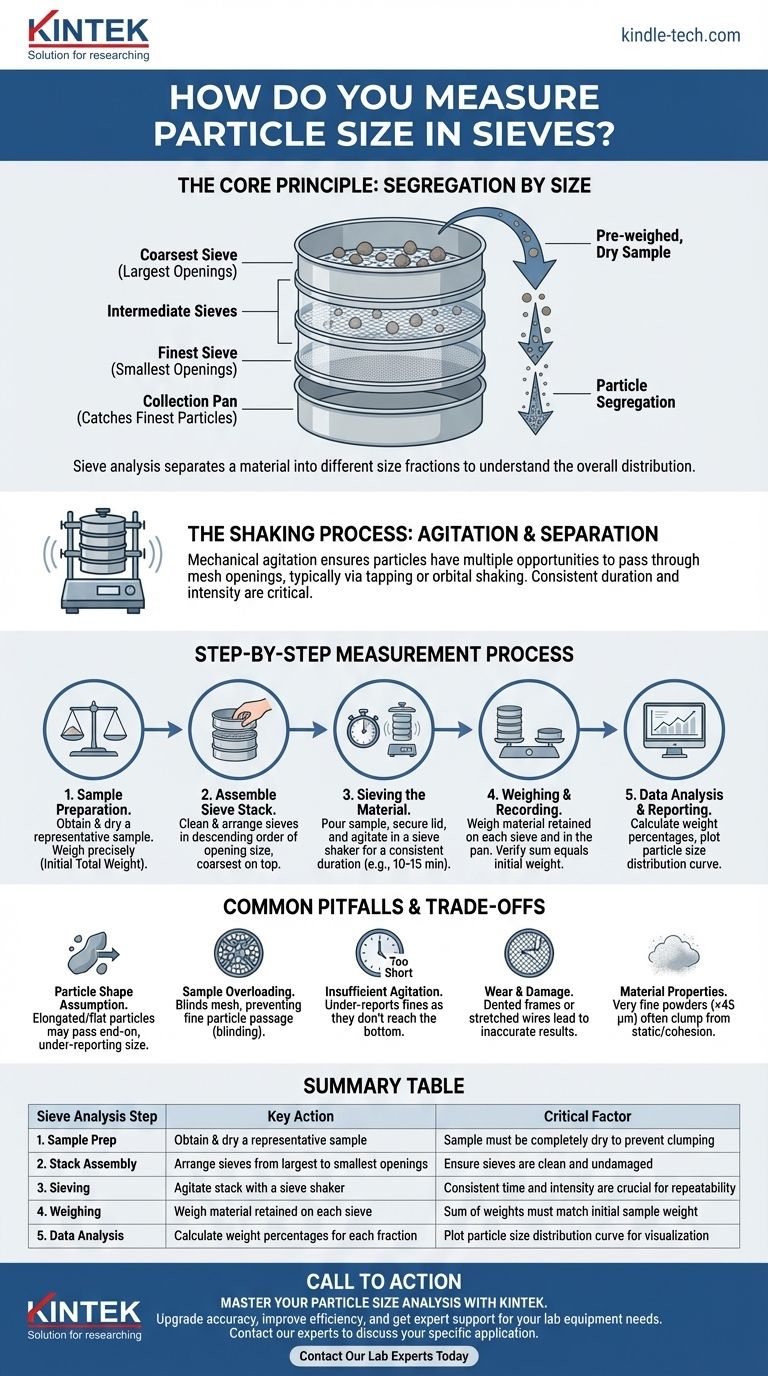
The Core Principle: Segregation by Size
Sieve analysis is a foundational technique in material science, geology, and engineering. Its goal is to characterize a granular material not by a single size, but by the proportion of particles that fall within different size ranges.
The Sieve Stack
A standard sieve analysis uses a nested stack of test sieves. The sieve with the largest mesh openings (the coarsest) is placed on top, with each subsequent sieve having a smaller opening size.
A solid collection pan is placed at the very bottom of the stack to catch the finest particles that pass through all the sieves. A lid is placed on the top sieve to prevent loss of material during agitation.
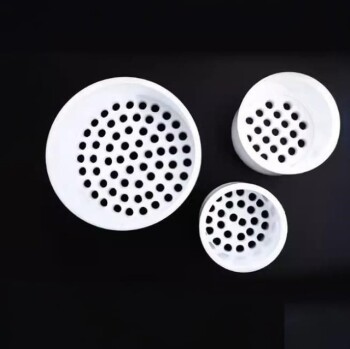
The Importance of Mesh Size
Sieve mesh is designated by a number that typically corresponds to the number of openings per linear inch (e.g., a "No. 200" sieve has 200 openings per inch).
This mesh number corresponds to a specific opening size, usually measured in millimeters (mm) or micrometers (µm). For example, a U.S. Standard No. 4 sieve has a 4.75 mm opening, while a No. 200 sieve has a 75 µm (or 0.075 mm) opening.
The Shaking Process: Agitation and Separation
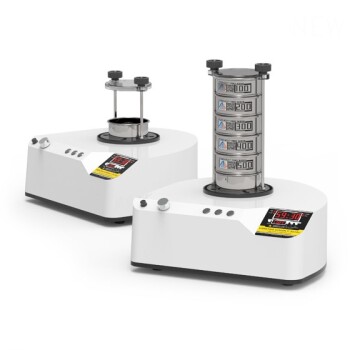
Simply pouring a sample onto the stack is not enough. The stack must be agitated mechanically to ensure each particle has multiple opportunities to find and pass through the mesh openings.
Sieve shakers provide this action through various motions, such as tapping, orbital shaking, or electromagnetic vibration. The duration and intensity of the shaking are critical parameters that must be kept consistent for repeatable results.
The Step-by-Step Measurement Process
Achieving accurate and repeatable results requires a standardized and meticulous procedure.
Step 1: Sample Preparation
First, obtain a representative sample of the bulk material. The sample must then be dried completely, as moisture can cause particles to clump together and skew the results.
Weigh the total dry sample with high precision before beginning the analysis. This initial weight is your baseline for all subsequent calculations.
Step 2: Assembling the Sieve Stack
Clean and inspect each sieve for damage. Arrange them in descending order of opening size, with the coarsest sieve on top and the finest at the bottom, just above the collection pan.
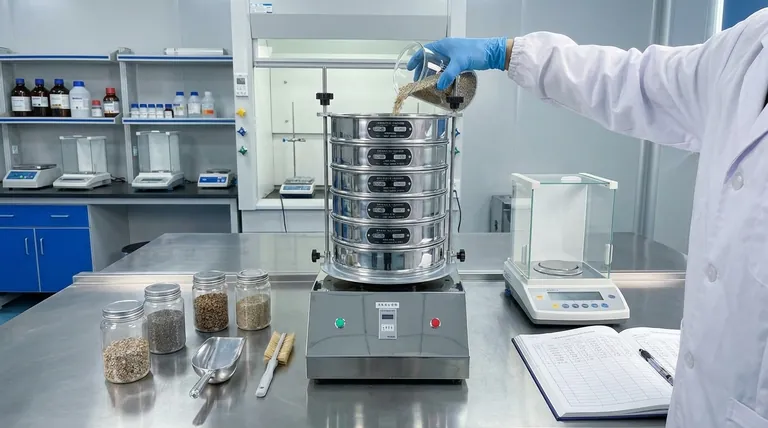
Step 3: Sieving the Material
Carefully pour the pre-weighed sample into the top sieve. Secure the lid, place the entire stack into the sieve shaker, and run the machine for a predetermined amount of time (e.g., 10-15 minutes).
Step 4: Weighing and Recording
After shaking is complete, carefully weigh the material retained on each individual sieve and in the bottom pan. Record these weights meticulously alongside the corresponding sieve size.
As a critical quality check, the sum of all the individual weights should be very close to the initial total sample weight. A significant difference indicates a loss of material or a measurement error.
Step 5: Data Analysis and Reporting
For each sieve, calculate the weight percentage of the material retained. This is typically presented in a table or plotted on a graph as a particle size distribution curve.
This curve, often showing the cumulative percentage of material passing through each sieve, provides a powerful visual summary of the material's gradation.
Understanding the Trade-offs and Common Pitfalls
While simple in principle, sieve analysis is prone to errors if its limitations are not understood.
Particle Shape Assumption
Sieve analysis fundamentally assumes particles are spherical. Elongated or flat (flaky) particles may pass through an opening end-on or diagonally, reporting a smaller size than their largest dimension. This is the single biggest limitation of the method.
Sample Overloading
Placing too much material on a sieve can "blind" the mesh, meaning the surface becomes clogged with particles. This prevents smaller particles from having a chance to pass through, causing them to be incorrectly reported in a larger size fraction.
Insufficient Agitation
If the shaking time is too short or the intensity is too low, fine particles will not have sufficient opportunity to travel down through the stack to the appropriate sieve. This leads to an over-reporting of coarse particles.
Wear and Damage to Sieves
Sieves are precision instruments. Dented frames, stretched wires, or clogged mesh will produce inaccurate results. Regular inspection and calibration (or replacement) are essential for quality control.
Material Properties
Very fine powders (< 45 µm) are often difficult to sieve due to forces like static electricity or cohesion causing them to agglomerate or stick to the mesh. For these materials, other methods like laser diffraction or air jet sieving may be more appropriate.
Making the Right Choice for Your Goal
Sieve analysis is a powerful tool when applied correctly. Your goal determines your focus.
- If your primary focus is routine quality control: Prioritize consistency above all else. Use a strictly defined procedure for sample weight, sieve stack, and shaking time to ensure your results are repeatable day after day.
- If your primary focus is material specification: Adhere strictly to industry standards (like ASTM or ISO) that define the required sieve sizes and acceptable passing percentages for your application (e.g., concrete aggregate, soil classification).
- If your primary focus is research and development: Understand the limitations, especially particle shape effects. Consider complementing your sieve analysis with another method, like image analysis, to get a more complete picture of your material's morphology.
Mastering sieve analysis gives you direct and reliable control over one of the most fundamental properties of any granular material.
Summary Table:
| Sieve Analysis Step | Key Action | Critical Factor |
|---|---|---|
| 1. Sample Prep | Obtain & dry a representative sample | Sample must be completely dry to prevent clumping |
| 2. Stack Assembly | Arrange sieves from largest to smallest openings | Ensure sieves are clean and undamaged |
| 3. Sieving | Agitate stack with a sieve shaker | Consistent time and intensity are crucial for repeatability |
| 4. Weighing | Weigh material retained on each sieve | Sum of weights must match initial sample weight |
| 5. Data Analysis | Calculate weight percentages for each fraction | Plot particle size distribution curve for visualization |
Master Your Particle Size Analysis with KINTEK
Accurate sieve analysis is fundamental to your product quality and research integrity. KINTEK specializes in providing high-quality lab sieves, sieve shakers, and consumables designed for precision and durability. Whether you're in quality control ensuring material specifications or in R&D characterizing new materials, our equipment delivers the reliable, repeatable results you need.
Let us help you achieve superior particle analysis:
- Upgrade your sieving accuracy with our certified test sieves.
- Improve efficiency and consistency with our range of mechanical and electromagnetic sieve shakers.
- Get expert support to select the right equipment for your specific application (e.g., ASTM/ISO standards).
Contact our lab equipment experts today to discuss your sieve analysis needs and ensure your processes are built on a foundation of precision.
Visual Guide
Related Products
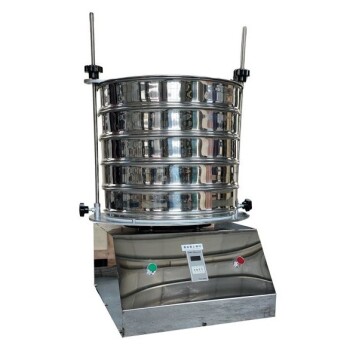
- Laboratory Test Sieves and Vibratory Sieve Shaker Machine
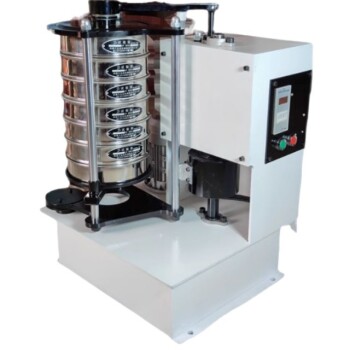
- Laboratory Test Sieves and Sieving Machines
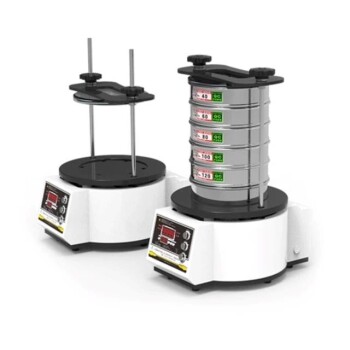
- Laboratory Vibratory Sieve Shaker Machine Slap Vibrating Sieve
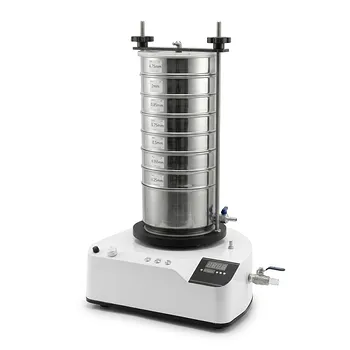
- Vibratory Sieve Shaker Machine Dry Three-Dimensional Vibrating Sieve
- Laboratory Vibratory Sieve Shaker Machine for Dry and Wet Three-Dimensional Sieving
People Also Ask
- What is the function of a vibratory sieve shaker? Achieve Precise Particle Size Analysis
- Why use a vibratory sieve shaker for PET powder? Achieve Precise Particle Size Control for Chemical Research
- What role does a laboratory vibrating sieve shaker play in the LiFePO4 powder processing workflow? Ensure Batch Quality
- How does a laboratory vibratory sieve shaker facilitate the microstructural study of gas-atomized alloy powders?
- How do you use a sieve shaker? Master Particle Size Analysis for Quality Control