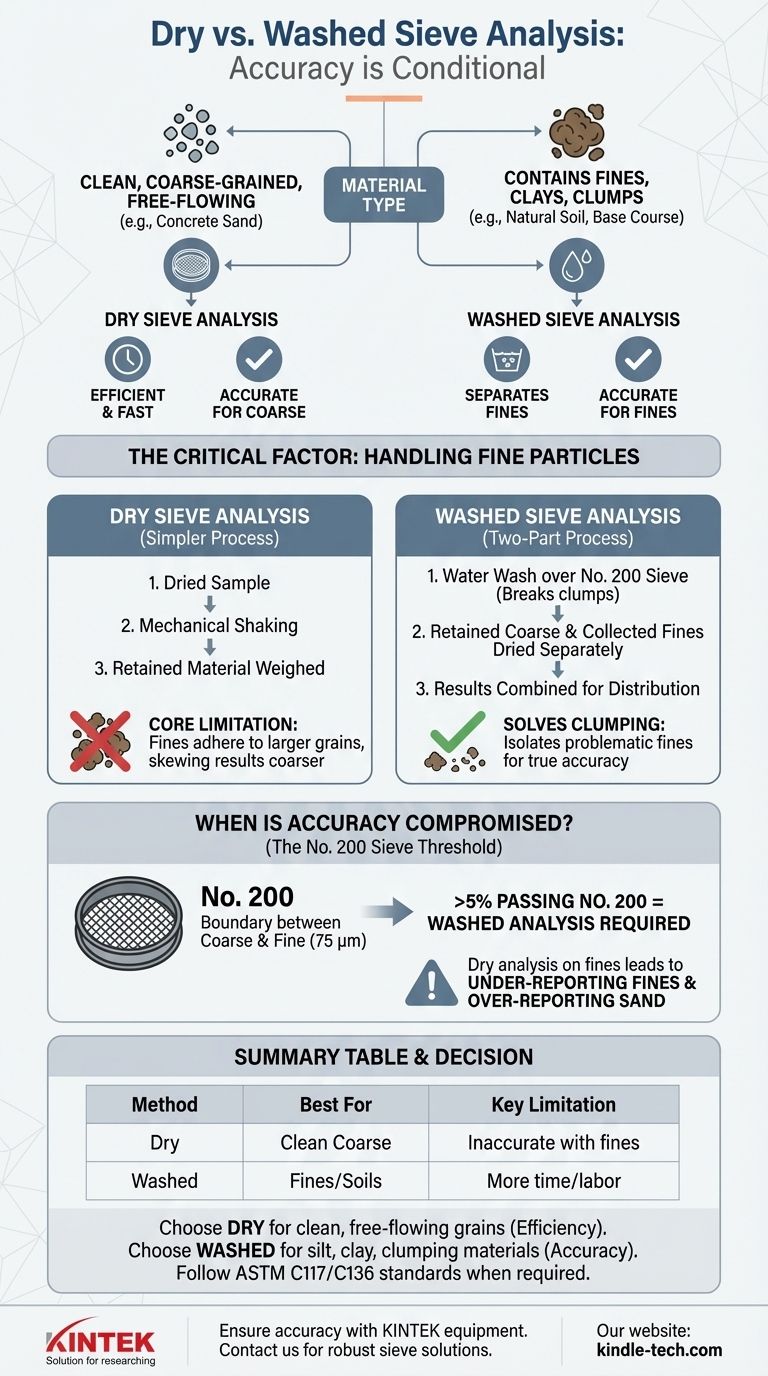
When comparing methodologies, one is not universally more accurate than the other; instead, its accuracy is conditional on the material being tested. A washed sieve analysis is significantly more accurate for materials containing fine particles like silt and clay that tend to clump together. For clean, coarse-grained, and free-flowing materials, a dry sieve analysis is both accurate and more efficient.
The critical factor in choosing a method is not a universal rule of accuracy, but an understanding of your material. The presence of fine particles (material finer than a No. 200 / 75 μm sieve) that can adhere to larger grains is the single most important variable that dictates whether a washed analysis is necessary.
The Fundamental Difference: Handling Fine Particles
The choice between a dry and washed sieve analysis comes down to how each method handles the finest fraction of a material sample. This is where results can dramatically diverge.
How Dry Sieve Analysis Works
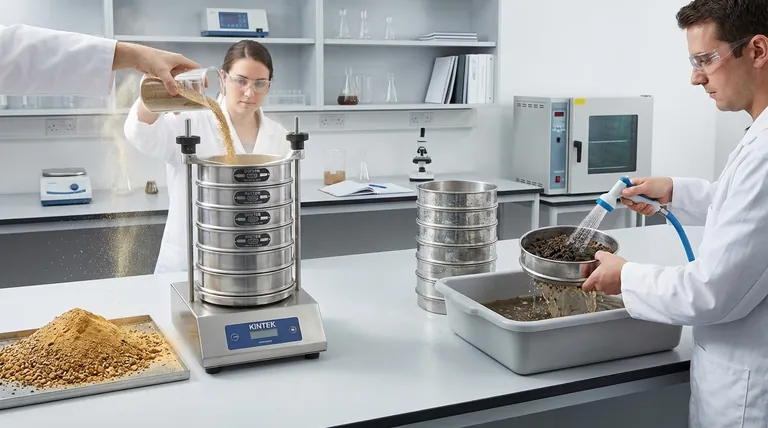
A dry sieve analysis is the simpler of the two methods. A dried sample of a known weight is placed into a stack of sieves and mechanically shaken for a set period. The material retained on each sieve is then weighed to determine the particle size distribution.
This method works perfectly when particles are distinct and do not stick together.
The Core Limitation of Dry Sieving
The primary weakness of dry sieving emerges with materials containing silts and clays. These fine particles electrostatically or physically adhere to the surfaces of larger sand and gravel particles.
This "clumping" prevents the fines from passing through the appropriate sieve openings during shaking. As a result, the analysis incorrectly measures these fines as part of a coarser fraction, skewing the entire distribution to appear coarser than it truly is.
How Washed Sieve Analysis Solves This
A washed sieve analysis (per standards like ASTM C117) directly addresses this problem. It is a two-part process designed to first isolate the problematic fine material.
First, the sample is washed with water over a fine sieve (typically the No. 200 or 75 µm sieve). This action breaks down clumps and washes away the fine silt and clay particles that were adhering to larger grains.
The coarse material retained on the sieve is then dried and run through a standard dry sieve analysis. The fine material that passed through the sieve is collected, dried, and weighed. The two results are then combined to produce a highly accurate particle size distribution.
When is Accuracy Compromised?
Knowing when to insist on a washed analysis is key to generating reliable data. Certain material properties are clear indicators that a dry analysis will be insufficient.
The Critical Threshold: The No. 200 Sieve (75 μm)
The boundary between coarse- and fine-grained soils is the No. 200 sieve (75 micrometers). Particles that pass through this sieve are generally classified as silts and clays.
If a material has a significant percentage (typically >5%) of particles finer than this sieve, a washed analysis is required for accuracy.
The Impact on Particle Size Distribution
Using a dry sieve on a sample with significant fines will lead to predictable errors. The analysis will under-report the percentage of fines and over-report the percentage of sand-sized particles.
This error can lead to incorrect material classification, failed quality control tests, and poor engineering decisions based on faulty data.
Visual and Physical Indicators
You can often identify the need for a washed analysis with a simple inspection. If the material is visibly dusty, feels cohesive or "plastic" when moist, or forms clumps that are difficult to break apart by hand, it contains fines that will invalidate a dry sieve result.
Understanding the Trade-offs
While a washed analysis offers greater precision for certain materials, it's important to recognize the practical trade-offs involved in selecting a method.
Washed Analysis: Precision at a Cost
The primary drawback of a washed analysis is that it is more labor-intensive and time-consuming. It requires a water source, a method for collecting the wash water, and an oven to dry both the washed coarse fraction and the collected fine fraction.
This added complexity introduces more steps where operator error can occur if procedures are not followed carefully.
Dry Analysis: Speed and Simplicity
The key advantage of a dry analysis is its efficiency. It requires less equipment, fewer steps, and provides a much faster turnaround time.
For quality control of materials known to be clean and free-flowing (like concrete sand or certain aggregates), a dry analysis is the appropriate and economical choice.
The Risk of Choosing Incorrectly
It is critical to understand that choosing dry analysis for a fine-grained material is not a simple "trade-off" for speed. It is an incorrect application of a method that produces invalid data. The time saved is worthless if the resulting particle size distribution is wrong.
Making the Right Choice for Your Material
To ensure your data is reliable, select your method based on a clear diagnosis of your material and the requirements of your project.
- If your primary focus is testing clean sand, gravel, or other free-flowing grains with minimal dust: A dry sieve analysis is the efficient and accurate choice.
- If your material contains silt, clay, or particles that clump together (e.g., most natural soils, base course, or crushed rock fines): A washed sieve analysis is essential for obtaining accurate results.
- If you are testing against a specific standard (like ASTM C136): You must use the method required by that standard. This nearly always mandates a washed analysis (per ASTM C117) to determine the percent passing the No. 200 sieve.
Ultimately, accurate analysis depends not on the inherent superiority of one method, but on correctly diagnosing your material and selecting the appropriate tool for the job.
Summary Table:
| Method | Best For | Key Limitation |
|---|---|---|
| Dry Sieve Analysis | Clean, coarse-grained, free-flowing materials (e.g., concrete sand) | Inaccurate for materials with significant fines (silt/clay) that cause clumping |
| Washed Sieve Analysis | Materials with fines (>5% passing No. 200 sieve), natural soils, base course | More time-consuming and labor-intensive |
Ensure the accuracy of your particle size data with the right equipment from KINTEK.
Choosing between dry and wet sieving is critical for reliable results in soil mechanics, aggregate testing, and quality control. KINTELY specializes in providing robust and precise lab equipment, including sieve shakers and full sieve analysis kits, designed to meet standards like ASTM C117 and C136.
Our experts can help you select the perfect solution for your specific material testing needs, ensuring your lab operates with maximum efficiency and data integrity.
Contact our team today to discuss your application and find the ideal sieving equipment for your laboratory.
Visual Guide
Related Products
- Vibratory Sieve Shaker Machine Dry Three-Dimensional Vibrating Sieve
- Laboratory Vibratory Sieve Shaker Machine for Dry and Wet Three-Dimensional Sieving
- Three-dimensional electromagnetic sieving instrument
- Laboratory Test Sieves and Vibratory Sieve Shaker Machine
- Laboratory Test Sieves and Sieving Machines
People Also Ask
- What is a vibrating sieve? A Precision Tool for Particle Size Analysis
- What is a vibrating sieve shaker? Achieve Accurate and Repeatable Particle Size Analysis
- How is a vibratory sieve shaker used in the particle size analysis of mechanically alloyed powders? Expert Guide
- How does a laboratory vibratory sieve contribute to the consistency of carbonate rock reaction kinetics studies?
- What is the function of a vibratory sieve shaker? Achieve Precise Particle Size Analysis