At its core, the difference is simple. Value at Risk (VaR) tells you the maximum amount of money you can expect to lose at a given confidence level, but it tells you nothing about what happens if you cross that line. Expected Shortfall (ESR), on the other hand, answers the critical follow-up question: when you do have a loss that exceeds your VaR threshold, ESR tells you the average size of that loss.
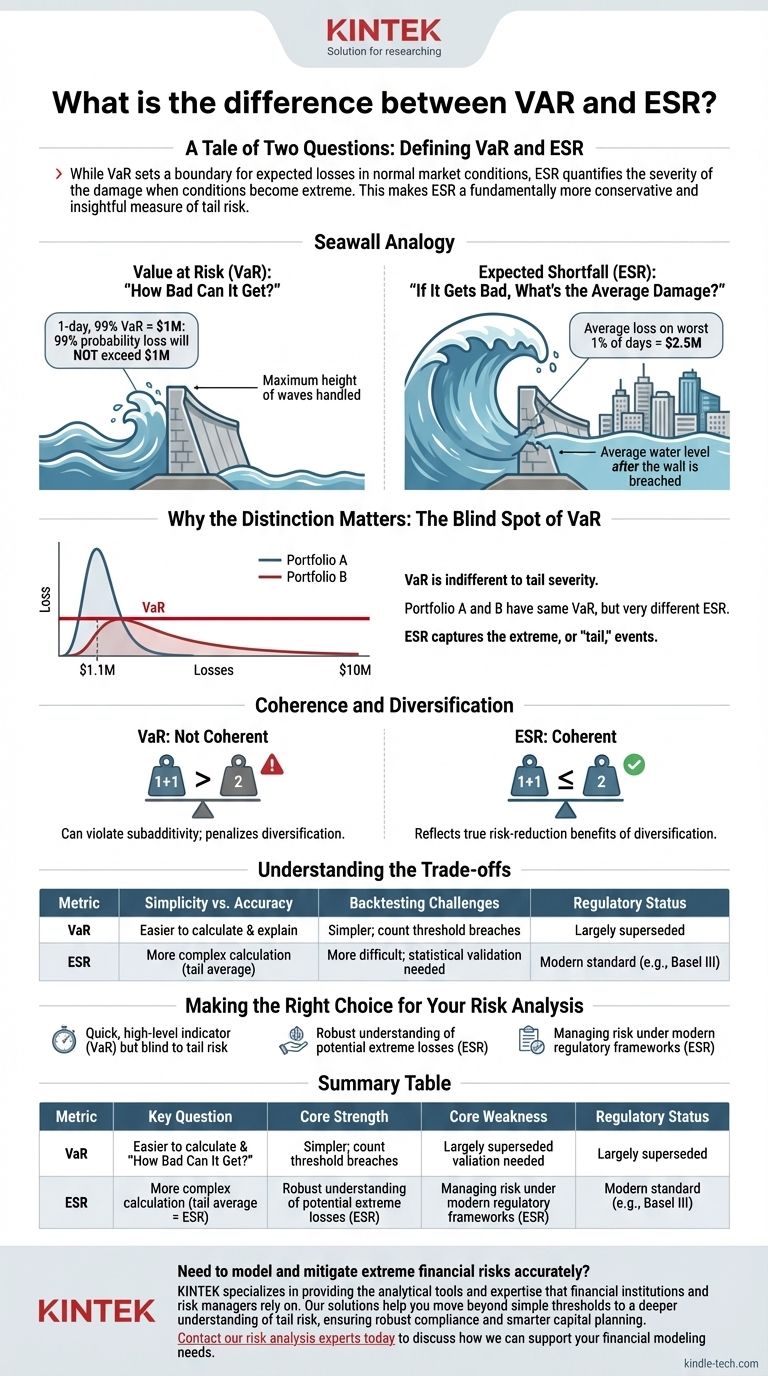
While VaR sets a boundary for expected losses in normal market conditions, ESR quantifies the severity of the damage when conditions become extreme. This makes ESR a fundamentally more conservative and insightful measure of tail risk.
A Tale of Two Questions: Defining VaR and ESR
To manage risk, we need metrics that answer specific questions. VaR and ESR are two of the most common, but they address very different aspects of potential loss.
Value at Risk (VaR): "How Bad Can It Get?"
VaR is a statistical measure that states a potential loss, a time frame, and a confidence level.
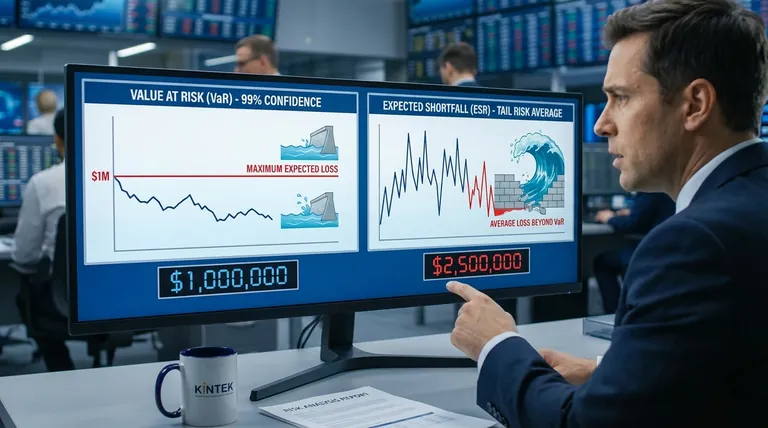
A 1-day, 99% VaR of $1 million means there is a 99% probability that you will not lose more than $1 million in the next day.
Think of VaR as a seawall. It's built to withstand 99% of all expected waves. It tells you the maximum height of the waves it can handle, but provides zero information about the tsunami that might one day surge past its limit.
Expected Shortfall (ESR): "If It Gets Bad, What's the Average Damage?"
Expected Shortfall, also known as Conditional VaR (CVaR), picks up exactly where VaR leaves off. It calculates the average of all losses that fall within the "tail" of the distribution—the area beyond the VaR threshold.
If your 1-day, 99% VaR is $1 million, the ESR would tell you the average loss you should expect on that worst 1% of days. That average might be $2.5 million, a far more useful number for planning capital reserves.
Using our seawall analogy, ESR tells you the average water level in the city after the wall has been breached.
Why the Distinction Matters: The Blind Spot of VaR
The theoretical difference between these metrics has profound practical consequences, particularly in how they account for extreme, or "tail," events.
The Problem of the Tail
VaR's greatest weakness is its indifference to the severity of losses beyond its threshold. Two different investment portfolios could have the exact same VaR of $1 million.
However, one portfolio's worst-case losses might cluster around $1.1 million, while the other's could extend to $10 million or more. VaR is blind to this crucial difference; ESR is not.
Coherence and Diversification
In risk management, a "coherent" risk measure is one that behaves logically. One of the most important properties is subadditivity, which means the risk of a combined portfolio should never be greater than the sum of the risks of its individual parts.
VaR is not a coherent risk measure because it can violate this principle. In some cases, it can penalize diversification by suggesting a combined portfolio is riskier than its components, which is counterintuitive.
ESR, by contrast, is a coherent risk measure. It always reflects the true risk-reduction benefits of diversification, making it a more reliable tool for portfolio construction.
Understanding the Trade-offs
While ESR is broadly considered superior, it's important to understand why VaR was used for so long and the practical considerations of each.
Simplicity vs. Accuracy
VaR is easier to calculate and, for many, more intuitive to explain at a high level. It provides a single number that is easy to report. ESR's calculation is more complex as it involves averaging the entire tail of the loss distribution.
Backtesting Challenges
It is much simpler to backtest VaR. You can look at historical data and count how many times the actual loss exceeded the VaR prediction. If your 99% VaR was breached more than 1% of the time, the model is flawed.
Backtesting ESR is more difficult because you are comparing a predicted average (ESR) against a series of unique, individual extreme losses, which requires more sophisticated statistical validation.
The Regulatory Shift
The 2008 financial crisis starkly revealed the shortcomings of VaR. Many institutions found that their losses in the tail far exceeded what VaR would have ever suggested.
In response, global regulatory bodies like the Basel Committee on Banking Supervision have largely replaced VaR with ESR as the standard for measuring market risk in banks' trading books. This is a powerful endorsement of ESR's ability to capture risk more effectively.
Making the Right Choice for Your Risk Analysis
Your choice of metric depends on the depth of risk insight you require.
- If your primary focus is a quick, high-level risk indicator: VaR can provide a simple threshold, but you must be acutely aware of its significant limitations and its blindness to tail risk.
- If your primary focus is a robust understanding of potential extreme losses: ESR is the superior metric, as it quantifies the severity of tail events and properly rewards diversification.
- If you are managing risk under modern regulatory frameworks: You must prioritize ESR, as it has become the gold standard for accurately capturing and capitalizing against market risk.
Ultimately, relying on ESR moves you from simply knowing a catastrophic loss is possible to truly understanding its potential magnitude.
Summary Table:
| Metric | Key Question Answered | Core Strength | Core Weakness | Regulatory Status |
|---|---|---|---|---|
| Value at Risk (VaR) | "How bad can it get under normal conditions?" | Simple to calculate and communicate. | Blind to severity of losses beyond its threshold; not a coherent measure. | Largely superseded. |
| Expected Shortfall (ESR) | "If it gets bad, what's the average damage?" | Measures average loss in the tail; a coherent risk measure. | More complex to calculate and backtest. | Modern standard (e.g., Basel III). |
Need to model and mitigate extreme financial risks accurately? KINTEK specializes in providing the analytical tools and expertise that financial institutions and risk managers rely on. Our solutions help you move beyond simple thresholds to a deeper understanding of tail risk, ensuring robust compliance and smarter capital planning. Contact our risk analysis experts today to discuss how we can support your financial modeling needs.
Visual Guide