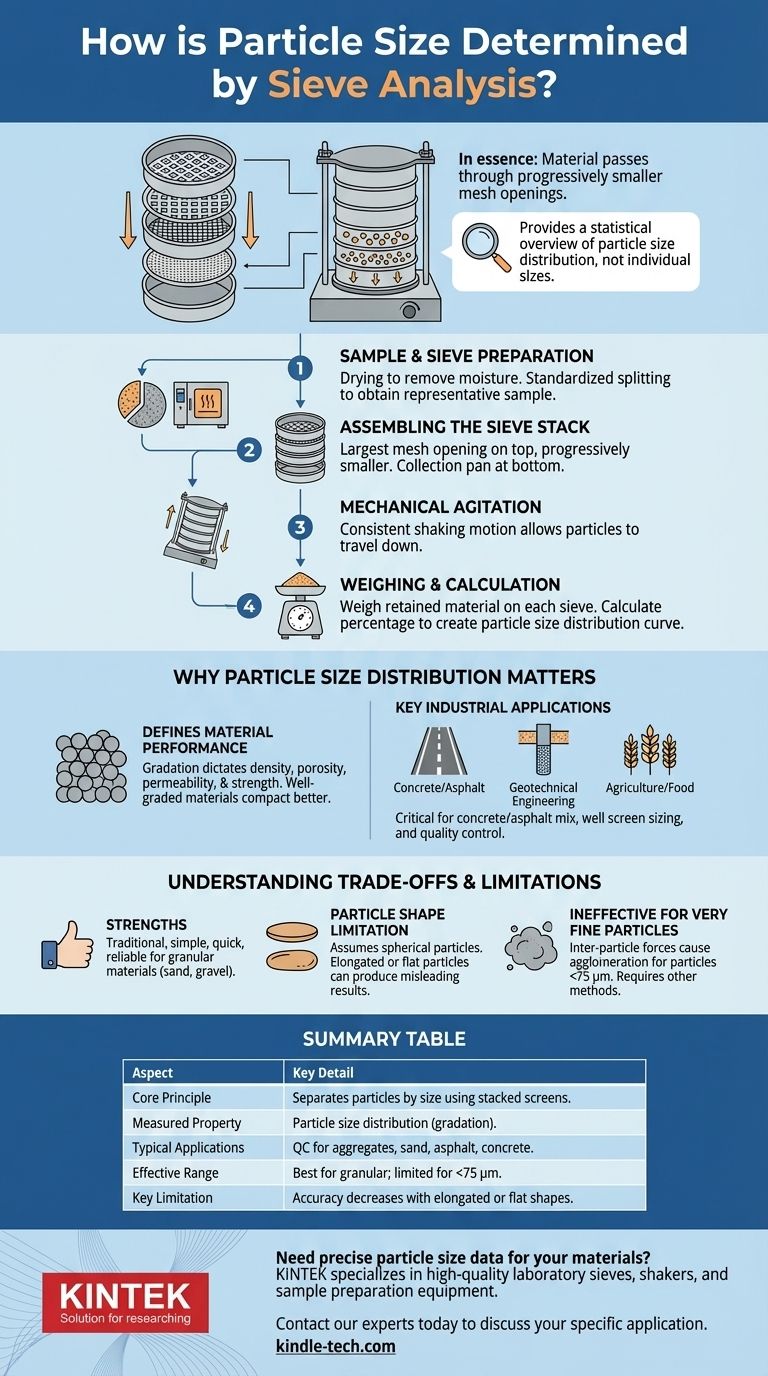
In essence, sieve analysis determines particle size distribution by passing a sample through a series of stacked screens with progressively smaller mesh openings. The material is shaken, allowing particles to fall through the screens until they are retained by one they cannot pass. By weighing the material collected on each screen, you can calculate the percentage of the sample that falls within each size range.
Sieve analysis does not measure the size of individual particles. Instead, it provides a statistical overview of the material's composition by separating it into different size fractions and quantifying the weight of each fraction.
The Sieve Analysis Process: A Step-by-Step Breakdown
Sieve analysis is a physical separation method. The process is standardized to ensure results are repeatable and comparable, regardless of who performs the test.
Step 1: Sample and Sieve Preparation
Before any measurement occurs, the sample must be properly prepared. This often involves drying the material to remove moisture, which can cause fine particles to clump together and skew the results.
A representative sample is obtained using a standardized sample splitting or quartering technique. This ensures the small portion being tested accurately reflects the entire batch of material.
Step 2: Assembling the Sieve Stack
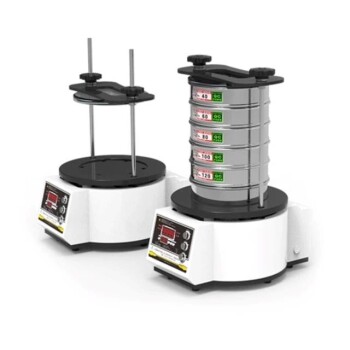
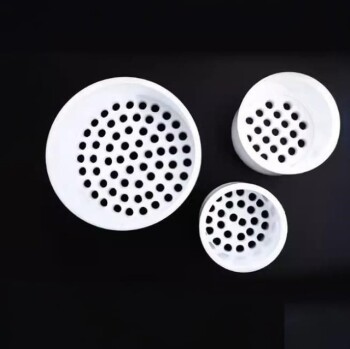
Sieves are stacked in a specific order. The sieve with the largest mesh opening is placed on top, followed by sieves with progressively smaller openings.
A solid collection pan is placed at the very bottom of the stack to collect the finest particles that pass through all the sieves.
Step 3: Mechanical Agitation
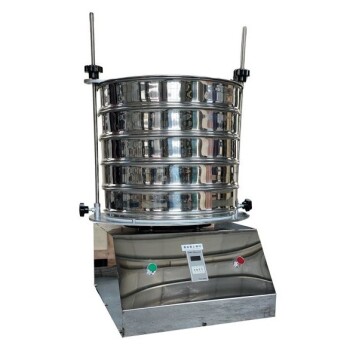
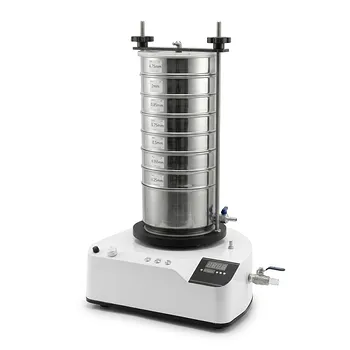
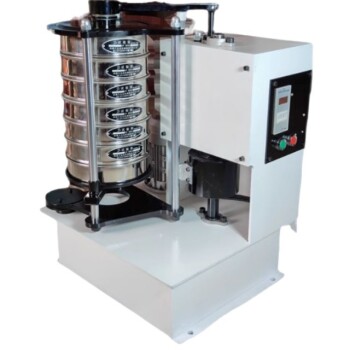
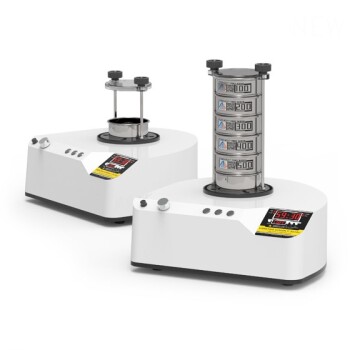
The pre-weighed, prepared sample is poured into the top sieve. The entire stack is then placed in a mechanical shaker.
The shaker agitates the stack with a consistent motion for a set period. This action allows particles to travel down through the stack until they are retained by a sieve with openings too small for them to pass through.
Step 4: Weighing and Calculation
After shaking is complete, the material retained on each individual sieve is carefully removed and weighed. The material in the bottom pan is also weighed.
These weights are used to calculate the percentage of material retained on each sieve. This data is then used to create a particle size distribution curve, which graphically represents the material's gradation.
Why Particle Size Distribution Matters
Understanding the distribution of particle sizes is not an academic exercise; it directly determines how a material will behave in a real-world application.
It Defines Material Performance
The mix of particle sizes, known as gradation, dictates critical physical properties. These include density, porosity, permeability, and strength.
For example, a material with a "well-graded" distribution (a good mix of large, medium, and small particles) will compact to a much denser and stronger state than a "poorly-graded" material composed of particles of all one size.
Key Industrial Applications
In concrete production, a proper aggregate gradation allows smaller particles to fill the voids between larger ones, reducing the amount of cement paste needed and increasing the final strength.
For asphalt mixes, the particle size distribution of the aggregate is critical for achieving the stability and durability required for road surfaces.
In geotechnical engineering, sieve analysis is used to size screens for water production wells, ensuring the screen can hold back the surrounding soil while allowing water to flow in freely.
Understanding the Trade-offs and Limitations
While sieve analysis is the most common method, it is essential to understand its specific strengths and weaknesses.
The Method's Strengths
Sieve analysis is the traditional and most widely used method for good reason. It is simple, relatively inexpensive, and provides quick and reliable results for a broad spectrum of particle sizes, particularly for granular materials like sand, gravel, and agricultural products.
Key Limitation: Particle Shape
Sieve analysis fundamentally assumes particles are spherical. It measures the second-smallest dimension of a particle—the one that determines if it can pass through a square mesh.
Elongated or flat particles can produce misleading results. A long, thin particle might pass through a sieve opening end-on but would be retained if it hit the screen sideways, leading to an inaccurate representation of its true size.
Ineffective for Very Fine Particles
For extremely fine powders, inter-particle forces (like static electricity or moisture) can cause particles to agglomerate or clump together. This prevents them from passing through the appropriate sieves, making dry sieve analysis unreliable for materials finer than about 75 micrometers.
For these fine materials, other methods like static light scattering (laser diffraction) or image analysis are often required for an accurate measurement.
Making the Right Choice for Your Goal
Selecting the correct particle analysis method depends entirely on your material and your objective.
- If your primary focus is quality control for granular materials like aggregates, sand, or grains: Sieve analysis remains the industry-standard method for its unmatched reliability and cost-effectiveness in this domain.
- If your primary focus is characterizing fine powders or materials with non-spherical shapes: You should supplement or replace sieve analysis with methods like laser diffraction or image analysis to get a more accurate and complete picture.
- If your primary focus is meeting regulatory or project specifications (e.g., ASTM standards): Sieve analysis is often the explicitly required method, and performing it correctly is non-negotiable for compliance.
Ultimately, understanding the principles and limitations of sieve analysis empowers you to confidently select and interpret the data needed for your project's success.
Summary Table:
| Sieve Analysis Aspect | Key Detail |
|---|---|
| Core Principle | Separates particles by size using a stack of screens with progressively smaller openings. |
| Measured Property | Particle size distribution (gradation), not individual particle size. |
| Typical Applications | Quality control for aggregates, sand, asphalt, concrete, and geotechnical engineering. |
| Effective Range | Best for granular materials; limited for particles finer than 75 µm. |
| Key Limitation | Assumes spherical particles; accuracy decreases with elongated or flat shapes. |
Need precise particle size data for your materials?
The right lab equipment is critical for accurate sieve analysis and reliable quality control. KINTEK specializes in high-quality laboratory sieves, shakers, and sample preparation equipment designed for durability and consistent results.
We serve industries where material gradation is paramount, including:
- Construction Materials (aggregates, cement, asphalt)
- Geotechnical Engineering
- Agriculture and Food Processing
- Pharmaceutical and Chemical Production
Let us help you achieve confidence in your material testing. Contact our experts today to discuss your specific application and find the ideal sieving solution for your laboratory.
Visual Guide
Related Products
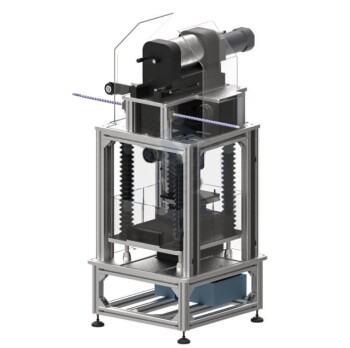
- Laboratory Test Sieves and Vibratory Sieve Shaker Machine
- Laboratory Test Sieves and Sieving Machines
- Laboratory Vibratory Sieve Shaker Machine for Dry and Wet Three-Dimensional Sieving
- Laboratory Vibratory Sieve Shaker Machine Slap Vibrating Sieve
- Three-dimensional electromagnetic sieving instrument
People Also Ask
- How does a laboratory vibratory sieve shaker facilitate the microstructural study of gas-atomized alloy powders?
- How is a vibratory sieve shaker used in the particle size analysis of mechanically alloyed powders? Expert Guide
- What role does a laboratory vibrating sieve shaker play in the LiFePO4 powder processing workflow? Ensure Batch Quality
- Why use a vibratory sieve shaker for PET powder? Achieve Precise Particle Size Control for Chemical Research
- How do you use a sieve shaker? Master Particle Size Analysis for Quality Control