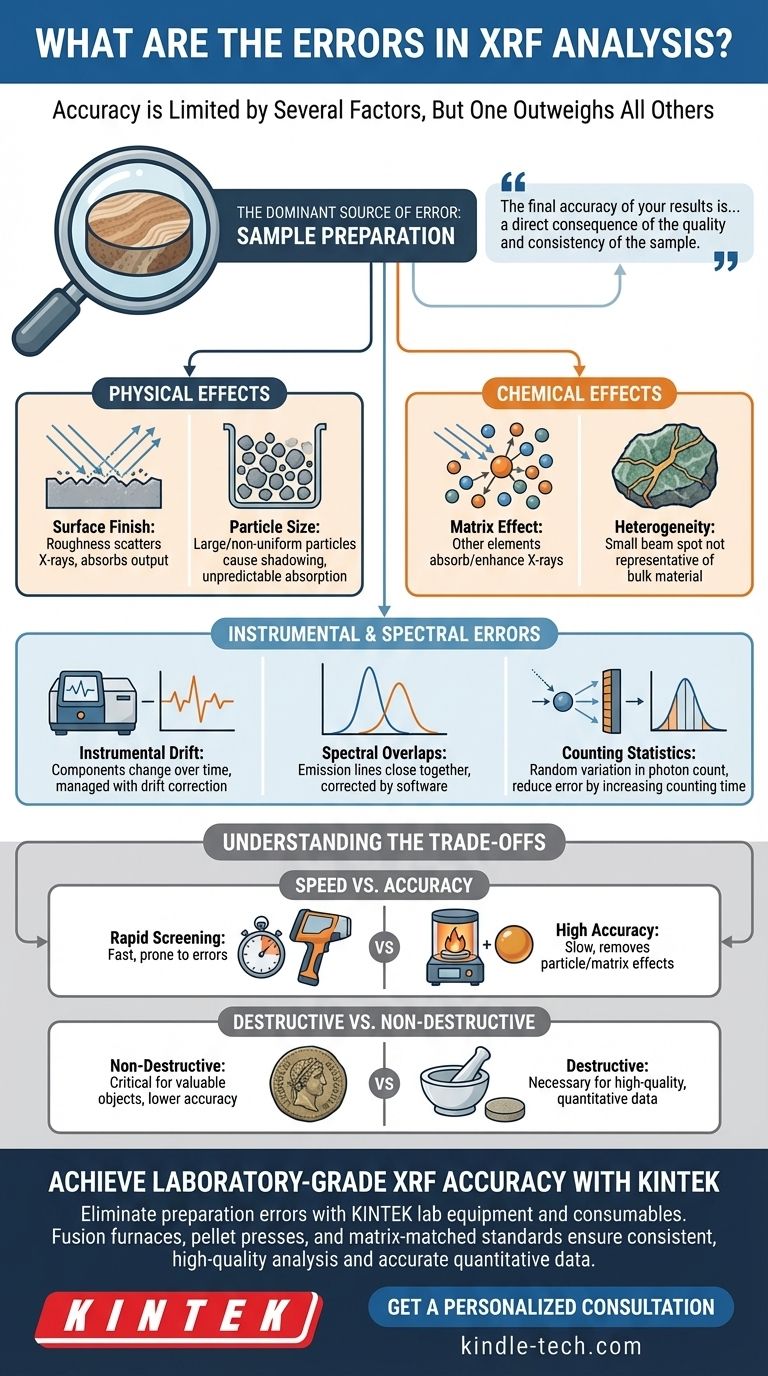
The accuracy of any XRF analysis is limited by a combination of factors, but modern instrumentation has become so stable and precise that one source of error now outweighs all others. While spectral interferences and instrumental drift play a role, the single most significant, and most controllable, source of error in X-ray Fluorescence is sample preparation.
Your XRF instrument is a highly precise tool, but it only measures what it is shown. The final accuracy of your results is therefore not a reflection of the machine's capability, but a direct consequence of the quality and consistency of the sample you present to it.
The Dominant Source of Error: Sample Preparation
The fundamental principle of XRF is comparative. The instrument measures the intensity of fluorescent X-rays from your unknown sample and compares it to the intensities from known calibration standards. If your sample is not physically and chemically identical to those standards in every way except for the concentrations of interest, errors are introduced.
Physical Effects: Surface and Particle Size
The X-rays generated and detected by the spectrometer interact with a very shallow layer of the sample. For lighter elements (like Na, Mg, Al), this can be mere micrometers.
Any irregularity in this layer will create errors. A rough surface finish scatters the primary X-rays and can absorb the outgoing fluorescent X-rays, leading to artificially low intensity counts.
Similarly, particle size effects in powders introduce significant error. Large or non-uniform particles create micro-scale shadowing, where some grains block X-rays from reaching others, and can cause unpredictable absorption, especially for light elements.
Chemical Effects: Matrix and Heterogeneity
The "matrix" is everything in the sample that is not the element you are trying to measure. These other elements can absorb or enhance the X-rays from your element of interest, an issue known as the matrix effect.
High-quality calibrations can correct for these effects, but only if the sample is homogeneous. If your sample is heterogeneous—for example, a mineral ore with veins of different composition—the small beam spot may analyze an area that is not representative of the bulk material, leading to large sampling errors.
Understanding Instrument and Spectral Errors
While less significant than sample preparation with modern equipment, instrumental and data processing errors are still present and must be understood.
Instrumental Drift
The components of the spectrometer, primarily the X-ray tube and the detector, can experience slight changes in performance over time due to temperature fluctuations or simple aging. This is known as drift.
Modern instruments are remarkably stable, often using internal temperature controls. However, for high-precision analysis, this drift is managed by running a "monitor" or "drift correction" sample periodically to normalize the results.
Spectral Overlaps
The emission lines of different elements can be very close to each other on the energy spectrum. A classic example is the overlap between the Lead (Pb) L-alpha line and the Arsenic (As) K-alpha line.
Sophisticated software algorithms are used to deconvolute these overlaps and correct the calculated concentrations. However, in cases of severe overlap where one element's peak is massive and the other is at a trace level, a residual error can remain.
Counting Statistics
The emission and detection of X-rays is a quantum process governed by Poisson statistics. This introduces a natural, random variation in the number of X-ray photons counted in a given time.
This statistical uncertainty is the ultimate limit on precision. It is most significant for elements at very low concentrations. The only way to reduce this error is to increase the counting time, which allows more X-ray photons to be collected, improving the signal-to-noise ratio.
Understanding the Trade-offs
Choosing the right approach requires balancing the need for accuracy against practical constraints like time and the nature of the sample itself.
Speed vs. Accuracy
A handheld XRF analyzing a sample "as is" provides an answer in seconds. This is exceptionally fast but prone to all the surface and heterogeneity errors mentioned above, making it best for sorting or screening, not quantitative science.
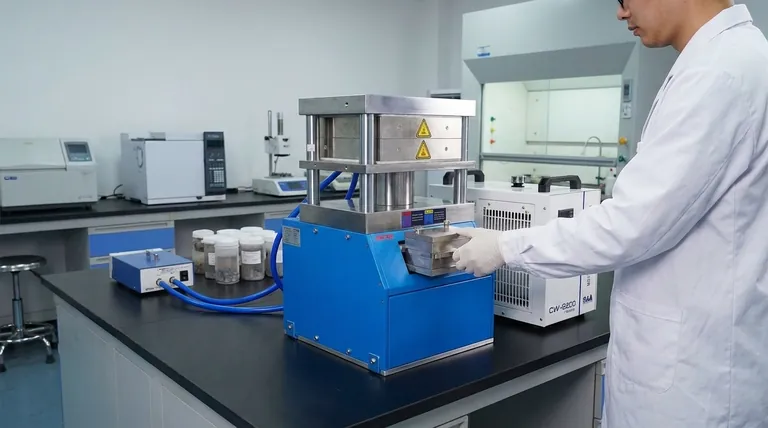
Conversely, fusing the sample into a perfect glass disk with lithium borate flux takes significant time and skill. However, this process eliminates almost all particle size and mineralogical effects, producing the most accurate and repeatable results possible.
Destructive vs. Non-destructive Analysis
Analyzing an unprepared object is non-destructive, which is critical for valuable artifacts, finished parts, or forensic evidence. You must accept the lower accuracy that comes with this method.
Proper preparation methods like cutting a sample, grinding it into a powder to press a pellet, or fusing it into a bead are all destructive. This is a necessary trade-off for achieving high-quality, quantitative chemical data.
Making the Right Choice for Your Goal
To minimize error, you must align your preparation technique with your analytical objective.
- If your primary focus is high-accuracy quantitative analysis: Invest your effort in creating homogeneous, repeatable samples (fused beads or pressed pellets) and using certified, matrix-matched calibration standards.
- If your primary focus is rapid screening or material identification: Accept the inherent inaccuracies of analyzing unprepared samples, but improve precision by ensuring surface consistency (e.g., wipe samples clean, always analyze a flat area).
- If you are troubleshooting inconsistent results: Immediately audit your entire sample preparation workflow—from grinding to pressing—for inconsistencies before you suspect an issue with the instrument.
Ultimately, mastering XRF is less about understanding the spectrometer and more about mastering the sample.
Summary Table:
| Error Type | Key Factor | Impact on Accuracy |
|---|---|---|
| Sample Preparation | Surface finish, particle size, heterogeneity | Highest Impact - Directly affects X-ray interaction and measurement consistency |
| Instrumental Drift | X-ray tube/detector aging, temperature fluctuations | Moderate Impact - Managed with drift correction protocols |
| Spectral Overlaps | Element emission line interference (e.g., Pb/As) | Moderate Impact - Corrected with software deconvolution |
| Counting Statistics | Low concentration elements, short counting times | Low Impact - Reduced by increasing counting time |
Achieve Laboratory-Grade XRF Accuracy with KINTEK
Your XRF results are only as reliable as your sample preparation. KINTEK specializes in lab equipment and consumables that eliminate preparation errors for consistent, high-quality analysis. Whether you need fusion furnaces for perfect glass beads, pellet presses for homogeneous powders, or matrix-matched standards for precise calibration, we provide the tools and expertise to ensure your XRF delivers accurate quantitative data.
Contact our experts today to discuss your specific application and discover how KINTEK solutions can enhance your XRF accuracy and laboratory efficiency.
Get a Personalized Consultation →
Visual Guide