To explain XRF results, you are interpreting two key pieces of information: the list of elements present in the sample (qualitative analysis) and the calculated amount of each element (quantitative analysis). The raw data is typically a spectrum showing energy peaks that act as elemental fingerprints, which is then processed into a simple table of elements and their concentrations.
XRF provides a powerful snapshot of a material's elemental makeup, but a correct interpretation requires understanding what the instrument sees and, more importantly, what it doesn't. The data is a starting point for analysis, not the final word.
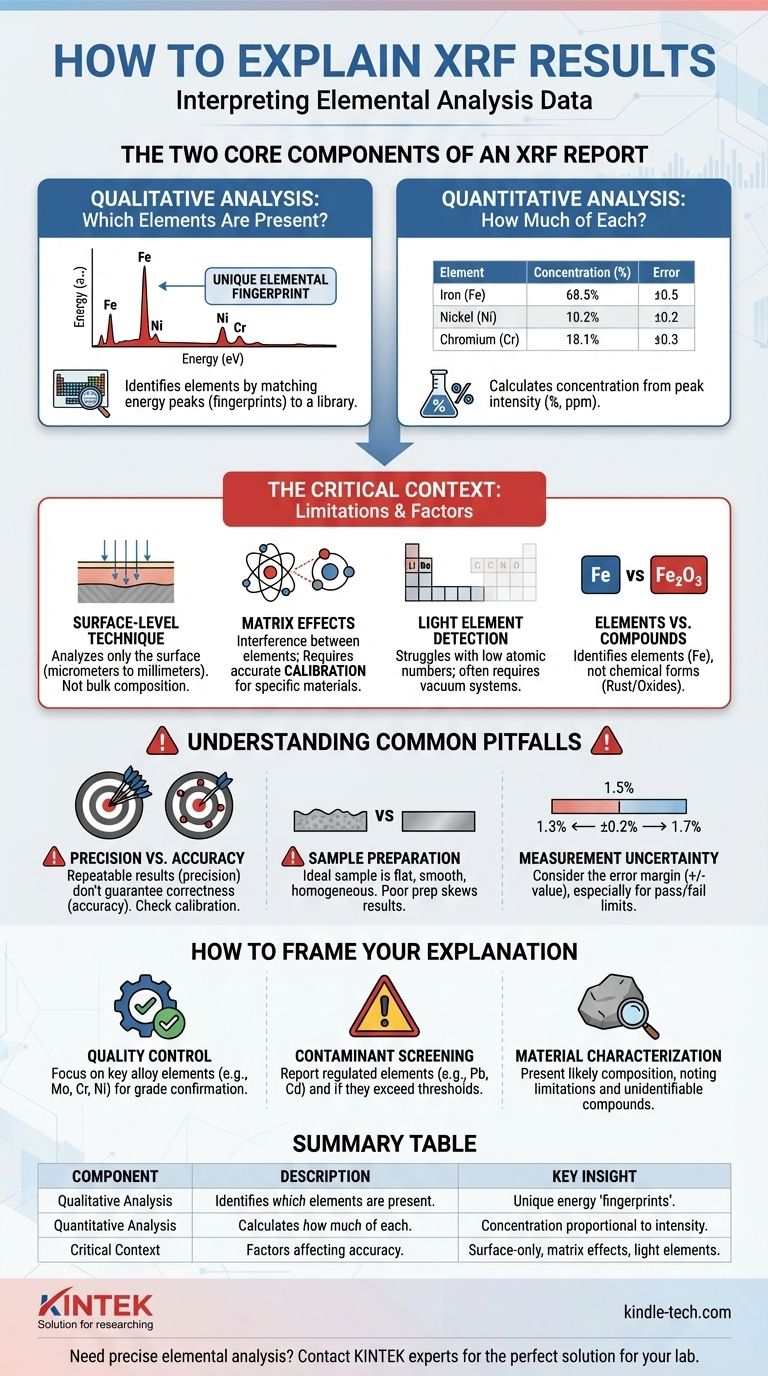
The Two Core Components of an XRF Report
An XRF report, whether on-screen or printed, boils down to answering two fundamental questions about your sample. Understanding both is essential for a complete explanation.
Qualitative Analysis: Which Elements Are Present?
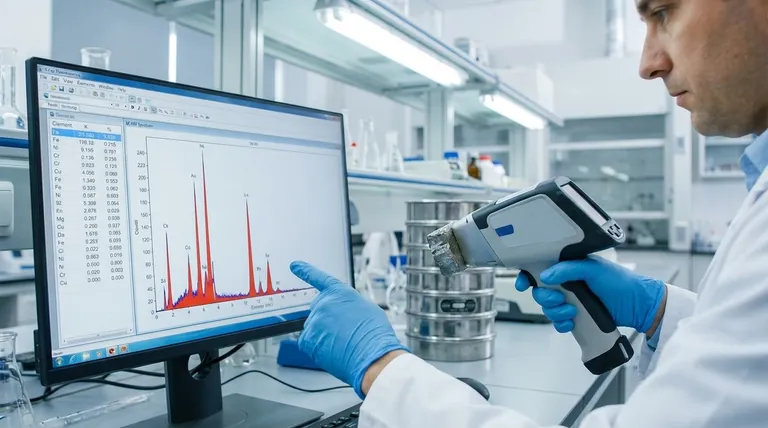
The foundational data from an XRF instrument is a spectrum—a graph showing X-ray intensity versus energy level (measured in keV).
Each element, when energized by X-rays, emits its own characteristic fluorescent X-rays at specific energy levels. This creates a unique "fingerprint."
The software identifies the elements in your sample by matching the energy peaks in the spectrum to the known fingerprints in its library.
Quantitative Analysis: How Much of Each Element is There?
Once the elements are identified, the instrument calculates their concentration. This is typically presented in a simple table.
The intensity of an element's energy peak is generally proportional to its concentration in the sample. A higher peak means more of that element.
The results are displayed as a percentage (%) for major components or in parts per million (ppm) for trace elements.
The Critical Context: Why the Numbers Aren't Absolute Truth
Simply reading the concentration table is insufficient. A proper explanation of XRF results must account for the inherent limitations and context of the measurement technique.
It's a Surface-Level Technique
XRF analysis is not a bulk analysis. The X-rays only penetrate a very shallow layer of the material, typically from a few micrometers to several millimeters, depending on the sample's density.
This means the results represent the composition of the surface only. If the material is coated, corroded, or not uniform throughout, the results will not reflect the bulk composition.
The Influence of "Matrix Effects"
The sample itself—the "matrix"—can interfere with the results. X-rays emitted by one element can be absorbed or enhanced by another element present in the sample.
This is why proper calibration is critical. An instrument calibrated for steel alloys will give inaccurate readings on a soil sample because the matrix is completely different.
The Limitations of Light Element Detection
Handheld and standard benchtop XRF analyzers struggle to detect very light elements (those with low atomic numbers, like Lithium, Carbon, Nitrogen, and Oxygen).
The low-energy X-rays these elements emit are often absorbed by the air or even the detector window before they can be measured. Specialized vacuum systems are required to measure them effectively.
Elements vs. Compounds
XRF identifies elements, not the chemical compounds they form.
For example, the report will show a concentration for Iron (Fe), but it cannot tell you if that iron is present as metallic iron, rust (iron oxide), or another iron-bearing mineral. This distinction must be made with other techniques or contextual knowledge.
Understanding the Common Pitfalls
To provide a truly expert explanation, you must be aware of the common ways XRF data can be misinterpreted.
Mistaking Precision for Accuracy
An instrument might give you the same, repeatable number every time (precision), but that number could still be wrong if the calibration is incorrect (accuracy).
Accuracy is determined by the quality of the calibration standards used. Always question whether the instrument was calibrated for the specific material type you are analyzing.
Ignoring Sample Preparation
The quality of the sample directly impacts the quality of the result. An ideal sample is flat, smooth, and homogeneous (uniform in composition).
A rough, uneven, or small sample can lead to inaccurate X-ray reflection and detection, skewing the quantitative results significantly.
Overlooking Measurement Uncertainty
Every result has an associated error or level of uncertainty (often shown as a "+/-" value).
A reading of 1.5% +/- 0.2% means the actual value is likely between 1.3% and 1.7%. This is especially important when checking if a material is close to a pass/fail specification limit.
How to Frame Your Explanation
Your final explanation should be tailored to the underlying goal of the analysis. Acknowledge the data, but frame it within the context of the objective.
- If your primary focus is quality control (e.g., "Is this 316 or 304 stainless steel?"): State the elemental concentrations that confirm or deny the grade, focusing on key elements like Molybdenum, Chromium, and Nickel, while noting the analysis was on the material's surface.
- If your primary focus is contaminant screening (e.g., "Does this plastic contain lead or cadmium?"): Report whether the regulated elements were detected and if their concentration is above or below the acceptable threshold, including the measurement uncertainty.
- If your primary focus is material characterization (e.g., "What is this rock made of?"): Present the list of major and minor elements as a likely representation of the material's composition, but be sure to state the limitations, such as the inability to detect light elements or identify specific mineral compounds.
Ultimately, a clear explanation of XRF results tells a story not just about what is in the material, but also about the confidence and context surrounding that knowledge.
Summary Table:
| Component | Description | Key Insight |
|---|---|---|
| Qualitative Analysis | Identifies which elements are present. | Based on unique energy "fingerprints" in the spectrum. |
| Quantitative Analysis | Calculates how much of each element is present. | Concentration is proportional to peak intensity (%, ppm). |
| Critical Context | Factors affecting result accuracy. | Includes surface-level analysis, matrix effects, and light element limitations. |
Need precise, reliable elemental analysis for your lab?
Interpreting XRF data accurately requires the right equipment and expertise. At KINTEK, we specialize in providing high-quality lab equipment and consumables tailored to your laboratory's specific needs. Our range of XRF analyzers and support services ensures you get accurate, actionable data for quality control, contaminant screening, and material characterization.
Let us help you achieve confidence in your results. Contact our experts today to discuss your application and find the perfect solution for your lab.
Visual Guide
Related Products
- XRF Boric Acid Lab Powder Pellet Pressing Mold for Laboratory Use
- XRF & KBR plastic ring lab Powder Pellet Pressing Mold for FTIR
- Laboratory Hydraulic Pellet Press for XRF KBR FTIR Lab Applications
- Automatic Laboratory Hydraulic Press for XRF & KBR Pellet Press
- XRD Sample Holder X-ray Diffractometer Powder Slide
People Also Ask
- How do you make XRF pellets? A 4-Step Guide to Flawless Sample Preparation
- What is the XRF method of sampling? Achieve Accurate Elemental Analysis with Proper Sample Prep
- What size sample for XRF? The Key to Accurate Elemental Analysis
- What is the purpose of using a mold for pellet pressing when preparing catalyst test samples? Ensure Data Consistency
- How does a laboratory powder pellet press facilitate the preparation of multi-layered gradient Al2O3/ZrO2 ceramic green bodies? Precision Bonding Techniques