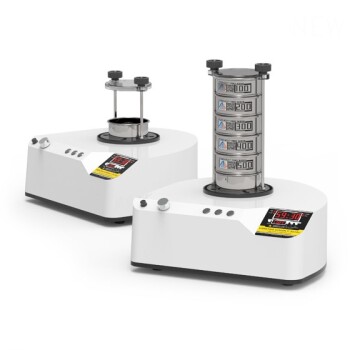
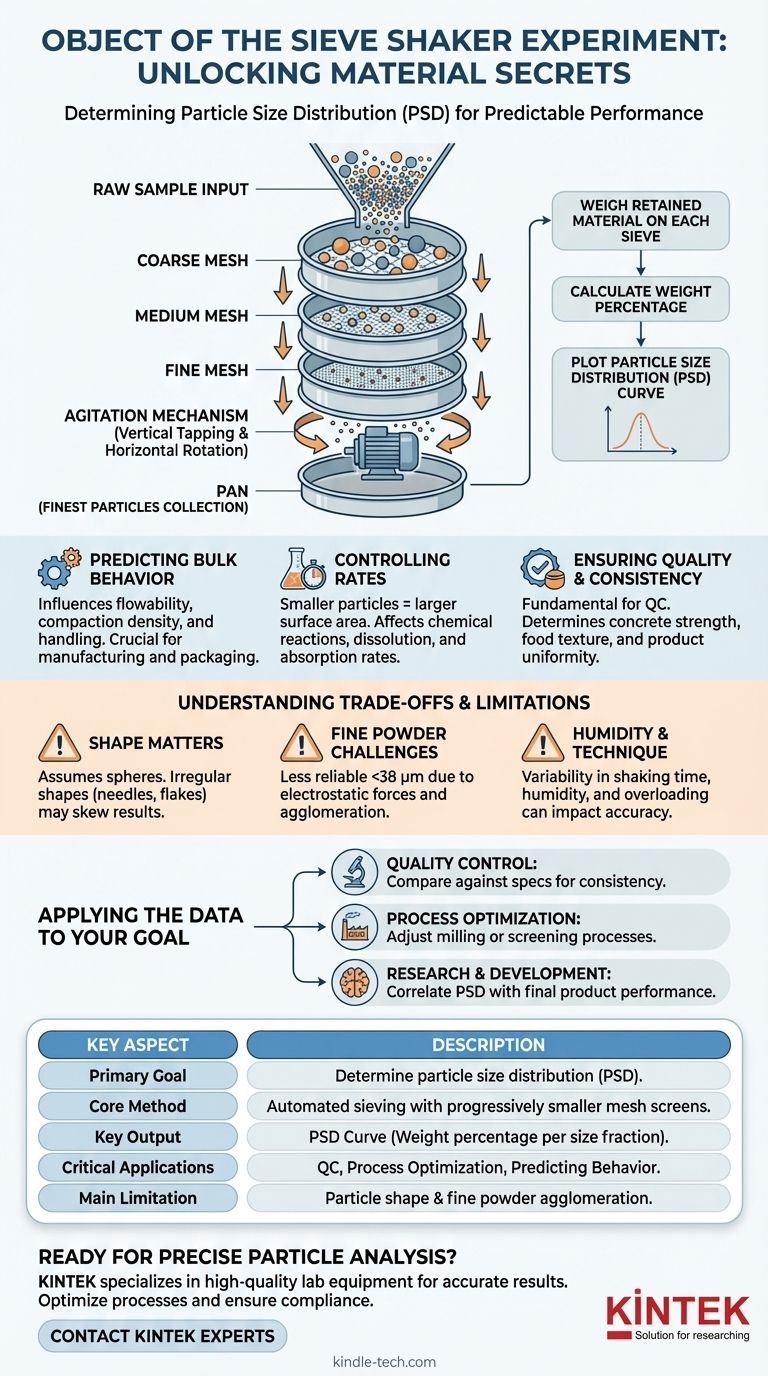
The primary object of a sieve shaker experiment is to determine the particle size distribution of a granular material. This foundational technique, known as sieve analysis, physically separates a dry sample into various size fractions by passing it through a stack of screens with progressively smaller mesh openings. The result is a quantitative breakdown of how many particles exist in each size range.
The ultimate goal extends beyond simple measurement. By understanding a material's particle size distribution, you gain the ability to predict and control its physical behavior, ensuring it meets the performance, quality, and safety requirements for its intended application.
What a Sieve Analysis Actually Measures
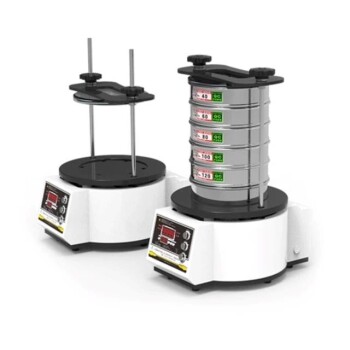
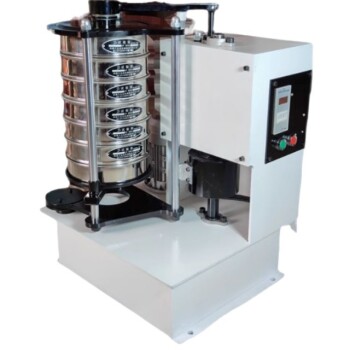
A sieve shaker automates the process of particle separation, providing reproducible data that forms a cornerstone of material characterization in many industries.
The Mechanics of Separation
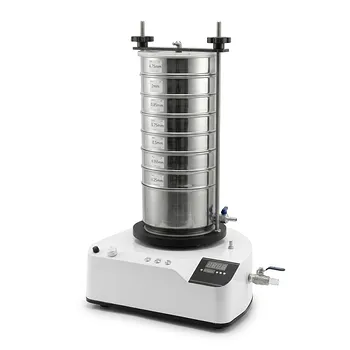
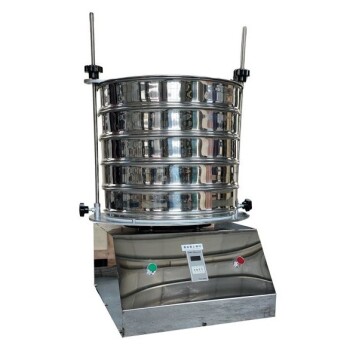
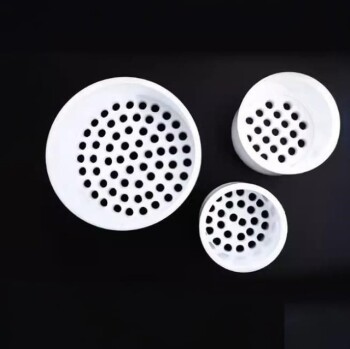
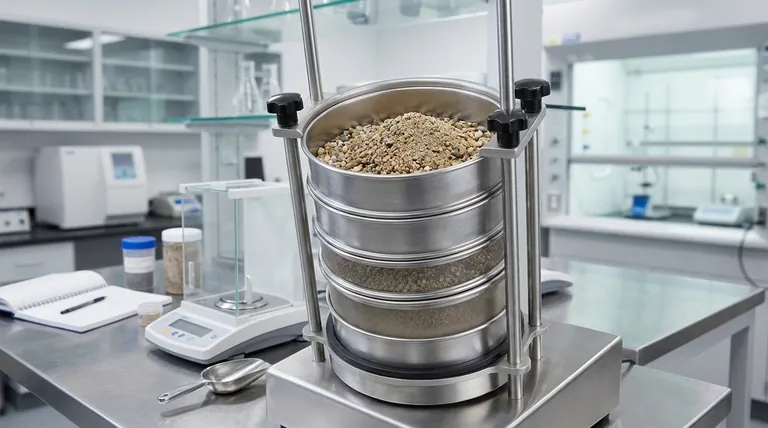
The process uses a nested stack of sieves, each with a wire mesh screen of a certified, specific aperture size. The sieve with the largest openings is placed at the top, and the sieves with progressively smaller openings are placed below it, ending with a solid pan at the bottom to collect the finest particles.
A carefully weighed sample of the material is placed in the top sieve. The sieve shaker then agitates the entire stack with a consistent motion—often a combination of vertical tapping and horizontal rotation—for a predetermined amount of time. This motion gives each particle the opportunity to pass through the mesh openings until it is retained on a sieve too small for it to pass.
From Raw Weights to a Distribution Curve
After the shaking stops, the material retained on each individual sieve is collected and weighed. By dividing the weight of the material on each sieve by the total initial weight of the sample, you can calculate the weight percentage for each size fraction.
This data is typically plotted on a graph to visualize the particle size distribution (PSD). This curve is the key output of the experiment, providing an immediate, clear picture of the material's granular makeup—whether it is predominantly coarse, fine, or has a wide spread of sizes.
Why Particle Size Distribution is a Critical Parameter
Understanding the PSD is vital because it directly governs many of a material's most important physical properties and behaviors.
Predicting Bulk Behavior
The size and distribution of particles dictate how a material will act in bulk. For example, it directly influences flowability and compaction density.
Coarse, uniform materials like dry sand tend to flow freely, while very fine powders like flour or talc are more cohesive and prone to clumping, making them difficult to handle. This has massive implications for automated dosing, packaging, and manufacturing processes.
Controlling Reaction and Dissolution Rates
For a given mass, a sample of smaller particles has a significantly larger total surface area than a sample of larger particles. This is a critical factor in chemistry and pharmaceuticals.
A larger surface area allows for faster chemical reactions, quicker dissolution of active ingredients in a drug, and more efficient absorption. Sieve analysis ensures that a material has the required fineness to achieve the desired performance.
Ensuring Quality and Consistency
In industries from construction to food processing, sieve analysis is a fundamental quality control test. The strength of concrete depends on a specific distribution of sand and aggregate sizes to ensure minimal voids. The texture and mouthfeel of many food products are determined by the particle size of ingredients like flour or sugar.
By performing a sieve analysis, a manufacturer can certify that an incoming raw material or a final product batch meets the established specifications, ensuring consistency from batch to batch.
Understanding the Trade-offs and Limitations
While powerful and widely used, sieve analysis is not a perfect method. Acknowledging its limitations is crucial for accurate interpretation.
Shape Matters: It's Not a Perfect Sphere
Sieve analysis assumes particles are roughly spherical. The test effectively measures a particle's second-smallest dimension, as this determines whether it can pass through a square mesh opening.
Long, needle-shaped, or flat, flaky particles may pass through openings that are smaller than their longest dimension. This can skew the results, making the material appear finer than it actually is.
Issues with Very Fine Powders
Sieve analysis becomes less reliable for particles smaller than about 38 micrometers (400 mesh). At this scale, electrostatic forces and moisture can cause particles to agglomerate, or stick together, preventing them from passing through the appropriate sieves.
For these very fine powders, alternative methods like laser diffraction or air jet sieving provide more accurate results.
The Human and Mechanical Element
While automated, the procedure is not immune to variability. Factors like the duration and intensity of shaking, the humidity of the lab, and overloading the sieves with too much sample can all impact the final result. Adhering to a standardized procedure (like an ASTM or ISO standard) is critical for achieving reproducible data.
Applying Sieve Analysis to Your Goal
How you use the data from a sieve analysis depends entirely on your objective.
- If your primary focus is quality control: Your goal is to compare your material's distribution curve against an established specification or a "golden batch" to ensure it falls within acceptable limits.
- If your primary focus is process optimization: You are using the data to adjust upstream processes, such as milling or screening, to produce a material with the desired particle size characteristics.
- If your primary focus is research and development: You are correlating different particle size distributions with changes in final product performance (e.g., tablet hardness, concrete strength) to discover the optimal material profile.
Ultimately, the sieve shaker experiment transforms a simple pile of powder or aggregate into a predictable and controllable engineering material.
Summary Table:
| Key Aspect | Description |
|---|---|
| Primary Goal | Determine the particle size distribution (PSD) of a granular material. |
| Core Method | Separate a dry sample through a stack of sieves with progressively smaller mesh sizes using automated agitation. |
| Key Output | A PSD curve showing the percentage of material in each size fraction. |
| Critical Applications | Quality control, process optimization, predicting flowability, compaction, and reaction rates. |
| Main Limitation | Assumes spherical particles; less reliable for very fine powders (<38 µm) due to agglomeration. |
Ready to achieve precise and reliable particle size analysis in your lab?
The data from a sieve shaker is fundamental for quality control and R&D. KINTEK specializes in high-quality lab equipment, including robust sieve shakers and certified test sieves, designed to deliver accurate and reproducible results for your granular materials.
Let us help you optimize your processes and ensure your products meet strict specifications.
Contact our experts today to find the perfect particle analysis solution for your laboratory's needs.
Visual Guide
Related Products
- Laboratory Vibratory Sieve Shaker Machine for Dry and Wet Three-Dimensional Sieving
- Laboratory Test Sieves and Vibratory Sieve Shaker Machine
- Laboratory Wet Three-Dimensional Vibratory Sieve Shaker Machine
- Vibratory Sieve Shaker Machine Dry Three-Dimensional Vibrating Sieve
- Laboratory Vibratory Sieve Shaker Machine Slap Vibrating Sieve
People Also Ask
- What is a sieving shaker? Automate Your Particle Size Analysis for Accurate Results
- Why use a vibratory sieve shaker for PET powder? Achieve Precise Particle Size Control for Chemical Research
- How are vibratory sieve shakers and standard sieves utilized to analyze the effects of biomass torrefaction? Optimize Grindability
- What is the principle of vibratory sieve shaker? Achieve Accurate Particle Size Analysis
- What is the use of vibratory sieve shaker? Achieve Precise Particle Size Analysis for Your Lab