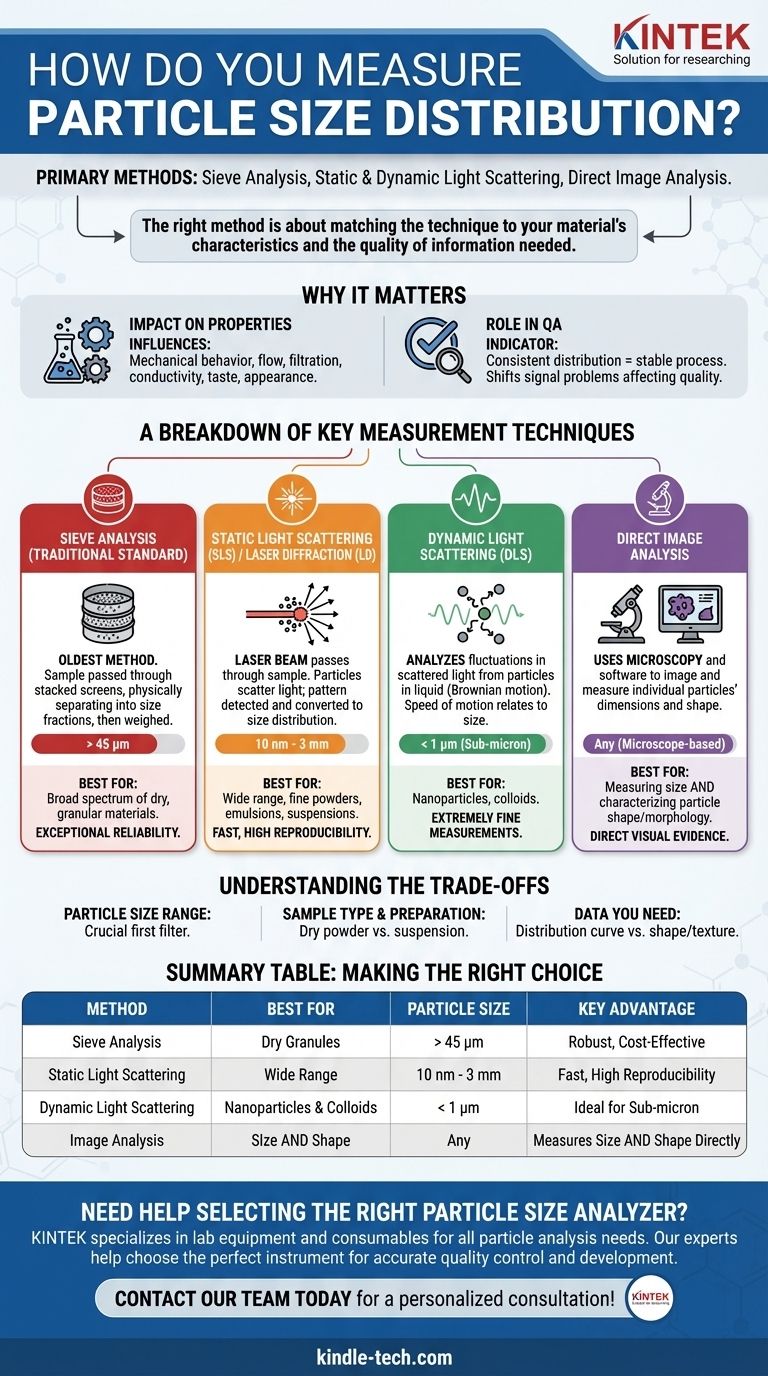
The primary methods for measuring particle size distribution are sieve analysis, static and dynamic light scattering, and direct image analysis. Each technique operates on a different principle and is suited for different types of materials and particle size ranges, from large granules down to sub-micron nanoparticles.
Choosing the right method is not about finding the "best" one, but about matching the technique to the specific characteristics of your material and the quality of information you need to obtain.
Why Particle Size Distribution Matters
Understanding the distribution of particle sizes within a material is a critical aspect of quality assurance and product development. It is not an abstract measurement; it directly influences the final product's performance and consistency.
Impact on Physical and Chemical Properties
The size and distribution of particles dictate crucial material properties. This includes mechanical bulk behavior, how a material flows, its filtration characteristics, conductivity, and even its taste or appearance.
The Role in Quality Assurance
For bulk goods, a consistent particle size distribution is a key indicator of a stable manufacturing process. Any unexpected shift in this distribution can signal a problem that will ultimately affect the quality of the finished product.
A Breakdown of Key Measurement Techniques
The most common methods for particle size analysis can be grouped into a few major categories, each with its own strengths.
Sieve Analysis (The Traditional Standard)
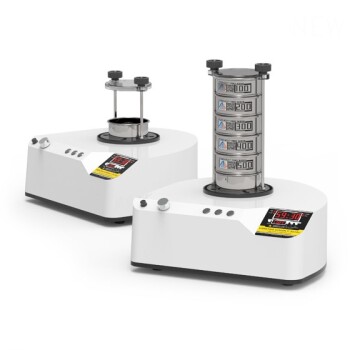
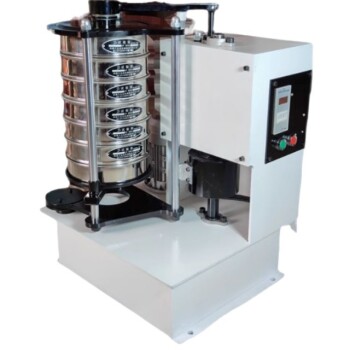
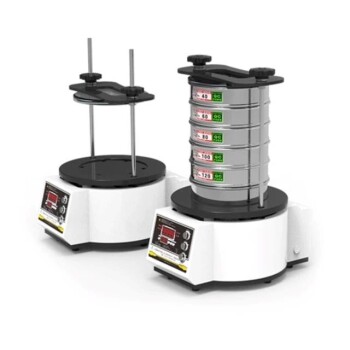
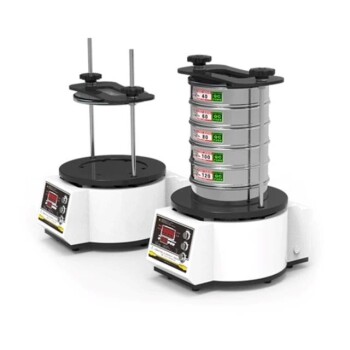
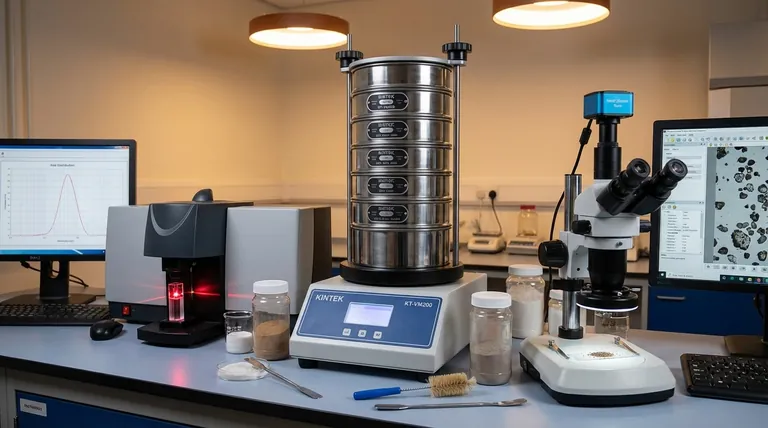
Sieve analysis is the oldest and most straightforward method. A sample is passed through a stack of screens with progressively smaller mesh sizes, physically separating the material into size fractions which are then weighed.
This technique is exceptionally reliable and ideal for analyzing a broad spectrum of dry, granular materials.
Static Light Scattering (SLS) / Laser Diffraction (LD)
This modern technique works by passing a laser beam through a dispersed sample. The particles scatter the light at different angles, with smaller particles scattering light at wider angles than larger ones.
Detectors measure the pattern of scattered light, which is then mathematically converted into a particle size distribution. It is fast, highly reproducible, and covers a very wide range of sizes.
Dynamic Light Scattering (DLS)
DLS is designed specifically for measuring very small, sub-micron particles and nanoparticles. It analyzes the fluctuations in scattered light caused by the Brownian motion of particles suspended in a liquid.
The speed of this motion is directly related to particle size, allowing for extremely fine measurements in the nanometer range.
Direct Image Analysis
This method uses microscopy and powerful software to take images of individual particles and measure their specific dimensions. It can be done on a static sample (on a slide) or on particles flowing past a camera (dynamic).
Its unique advantage is the ability to not only measure size but also characterize particle shape, which is critical for certain applications.
Understanding the Trade-offs
No single method is perfect for every situation. The choice involves clear trade-offs based on your material and analysis goals.
Particle Size Range is Crucial
Your expected particle size is the first filter. Sieve analysis is best for particles you can see, generally above 45 microns. Laser diffraction excels across a broad mid-range (high nanometers to millimeters), while DLS is the expert for the sub-micron world.
Sample Type and Preparation
Consider your material. Is it a dry powder that can flow freely? Sieve analysis is a great fit. If your material is a fine powder, an emulsion, or must be suspended in a liquid for measurement, a light scattering method is more appropriate.
The Data You Actually Need
If you need a reliable distribution curve for routine process control, sieving or laser diffraction is efficient. If you need to understand the shape, surface texture, or aggregation of your particles, image analysis is the only technique that provides that direct visual evidence.
Making the Right Choice for Your Goal
Select your analysis method based on the specific question you are trying to answer.
- If your primary focus is routine quality control for larger granular materials: Sieve analysis is the most robust, direct, and cost-effective method.
- If your primary focus is high-resolution analysis of fine powders, emulsions, or suspensions: Static Light Scattering (Laser Diffraction) offers excellent speed and reproducibility across a wide size range.
- If your primary focus is characterizing nanoparticles or colloids: Dynamic Light Scattering is the industry standard for precise measurement in the sub-micron realm.
- If your primary focus is understanding particle shape and morphology: Direct Image Analysis provides indispensable visual data that other methods cannot capture.
By aligning your measurement technique with your material and objective, you unlock precise and actionable insights into your product's behavior.
Summary Table:
| Method | Best For Particle Size | Key Advantage |
|---|---|---|
| Sieve Analysis | > 45 µm | Robust, cost-effective for dry granules |
| Static Light Scattering | 10 nm - 3 mm | Fast, wide range, high reproducibility |
| Dynamic Light Scattering | < 1 µm | Ideal for nanoparticles & colloids |
| Image Analysis | Any (microscope-based) | Measures size AND shape directly |
Need help selecting the right particle size analyzer for your lab?
KINTEK specializes in lab equipment and consumables for all your particle analysis needs. Our experts can help you choose the perfect instrument—from robust sieve shakers to advanced laser diffraction systems—to ensure accurate quality control and product development.
Contact our team today for a personalized consultation!
Visual Guide
Related Products
- Laboratory Test Sieves and Vibratory Sieve Shaker Machine
- Three-dimensional electromagnetic sieving instrument
- Laboratory Vibratory Sieve Shaker Machine Slap Vibrating Sieve
- Vibratory Sieve Shaker Machine Dry Three-Dimensional Vibrating Sieve
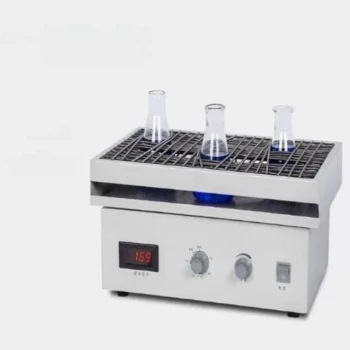
- Laboratory Multifunctional Small Speed-Adjustable Horizontal Mechanical Shaker for Lab
People Also Ask
- Role of Mechanical Disassembly and Sieving in Recycling Lithium Battery Anodes? Achieve 99%+ Purity Feedstock
- How to choose sieve size? Build the Perfect Sieve Stack for Accurate Particle Analysis
- Why is a 325-mesh standard sieve used for gold recovery? Enhance Adsorption Precision with 0.044mm Particle Control
- What is the primary function of fine-mesh test sieves? Master Natural Mordenite Purification
- What are the steps in sieving method? A Guide to Accurate Particle Size Separation
- What does a sieve test determine? A Guide to Accurate Particle Size Distribution
- Why is it necessary to pass mixed graphene/alumina composite powder through a 200-mesh sieve after vacuum drying? Guide
- What is the primary purpose of using a 200-mesh standard sieve in coal combustion? Ensure Precise Particle Sizing

