In infrared (IR) spectroscopy, concentration directly governs the intensity of absorption bands. A higher concentration of an analyte in a sample results in a greater absorption of IR radiation at its characteristic frequencies. This causes the corresponding peaks in the IR spectrum to become taller and more prominent, a relationship mathematically described by the Beer-Lambert Law.
The relationship between concentration and IR absorbance is powerful for quantitative analysis but is not perfectly linear in all situations. Understanding its practical limitations, such as detector saturation at high concentrations and intermolecular effects, is crucial for accurate spectral interpretation and measurement.
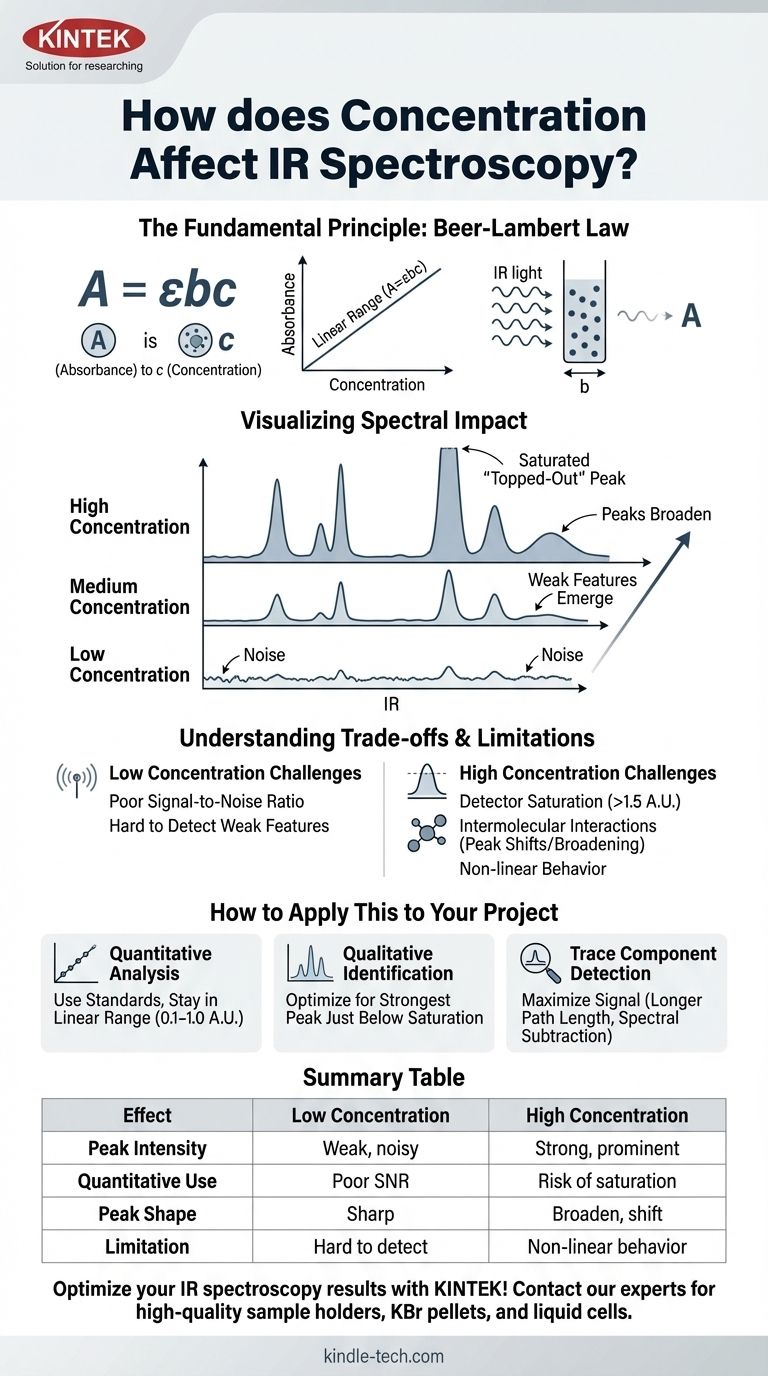
The Fundamental Principle: The Beer-Lambert Law
The connection between concentration and absorbance is the cornerstone of quantitative spectroscopy. It provides a predictable model for how light interacts with matter.
Defining the Equation (A = εbc)
The Beer-Lambert Law is expressed as A = εbc.
- A is Absorbance (unitless).
- ε (epsilon) is the molar absorptivity, an intrinsic property of the molecule at a specific wavelength.
- b is the path length of the sample holder (e.g., the thickness of a liquid cell), usually in cm.
- c is the concentration of the analyte.
This equation shows that absorbance is directly proportional to concentration when the path length and molar absorptivity are constant.
Absorbance vs. Transmittance
IR instruments physically measure Transmittance (%T), which is the fraction of light that passes through the sample. However, analysts almost always work with Absorbance (A).
The two are related by the formula A = -log(T). Plotting absorbance versus concentration yields a straight line, which is far more useful for analysis than the exponential curve produced by transmittance.
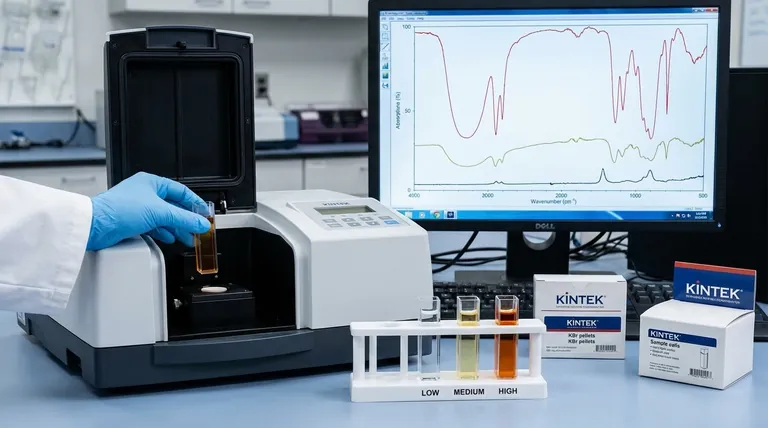
Visualizing the Spectral Impact
As you increase the concentration of a substance:
- Peaks grow taller: The absorbance values for all peaks increase.
- Weak features emerge: Small peaks that were lost in the baseline noise at low concentrations become visible.
- Strong peaks broaden: Very intense absorption bands will not only get taller but also wider.
Understanding the Trade-offs and Limitations
The Beer-Lambert law describes an ideal scenario. In practice, several factors can cause deviations from this linear relationship, especially at high concentrations.
The Problem of "Topped-Out" Peaks
When concentration is too high, a peak can become so intense that it absorbs nearly all the light at that frequency. The absorbance may exceed the optimal range of the detector (typically > 1.5 A.U.).
This causes the peak to appear flattened or "clipped" at the top. All quantitative information in that saturated peak is lost, as the instrument can no longer accurately measure the true absorbance.
Intermolecular Interactions
At high concentrations, molecules are closer together and can interact with each other. A classic example is hydrogen bonding in alcohols or carboxylic acids.
These interactions can alter the vibrational energy of the bonds, causing peaks to shift position, change shape, or broaden. This changes the molar absorptivity (ε), breaking the simple linear relationship between absorbance and concentration.
Instrumental Effects
No instrument is perfect. A small amount of stray light can reach the detector without passing through the sample. This causes absorbance readings to plateau at high concentrations, leading to a curve that bends toward the x-axis instead of remaining linear.
The Challenge of Low Concentrations
Conversely, if a sample is too dilute, the absorbance may be too low to distinguish from the instrumental baseline noise. The poor signal-to-noise ratio makes both qualitative identification and quantitative measurement unreliable.
How to Apply This to Your Project
Your approach to sample concentration depends entirely on your analytical goal. You must prepare your sample in a way that optimizes the spectrum for your specific purpose.
- If your primary focus is quantitative analysis: Prepare a series of standards and create a calibration curve, ensuring your unknown sample's absorbance falls within the linear range of your curve (typically 0.1–1.0 A.U.).
- If your primary focus is qualitative identification: Adjust your sample preparation (e.g., amount in a KBr pellet, path length of a liquid cell) to get a spectrum where the strongest peak is just below saturation, ensuring weaker functional group bands are clearly visible.
- If your primary focus is detecting a trace component: Use techniques that maximize the analyte's signal, such as employing longer path length cells or performing spectral subtraction to remove interference from a solvent or matrix.
Ultimately, controlling and understanding concentration is the key to transforming an IR spectrum from a simple fingerprint into a precise analytical tool.
Summary Table:
| Effect of Concentration | Low Concentration | High Concentration |
|---|---|---|
| Peak Intensity | Weak, noisy peaks | Strong, prominent peaks |
| Quantitative Use | Poor signal-to-noise ratio | Risk of detector saturation |
| Peak Shape | Sharp, well-defined | Can broaden and shift |
| Key Limitation | Hard to detect | Non-linear Beer-Lambert behavior |
Optimize your IR spectroscopy results with KINTEK!
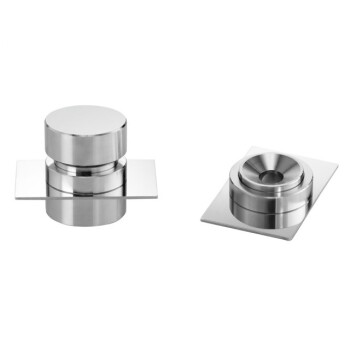
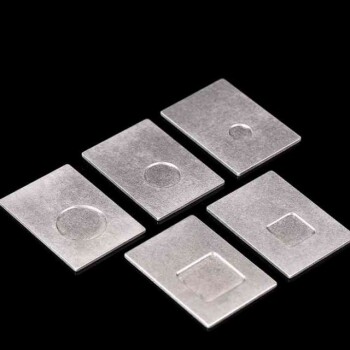
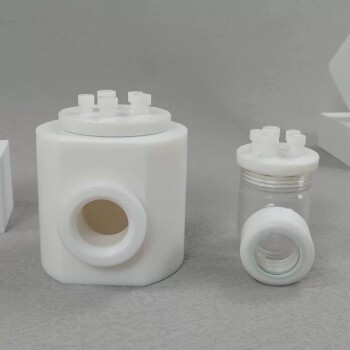
Whether you're performing precise quantitative analysis or need reliable qualitative identification, proper sample preparation is key. KINTEK specializes in high-quality lab equipment and consumables, including IR sample holders, KBr pellets, and liquid cells designed to help you achieve optimal concentration and path length for clear, accurate spectra.
Contact our experts today to discuss your specific laboratory needs and discover how our solutions can enhance your spectroscopy workflow and data reliability.
Visual Guide
Related Products
- Infrared High Resistance Single Crystal Silicon Lens
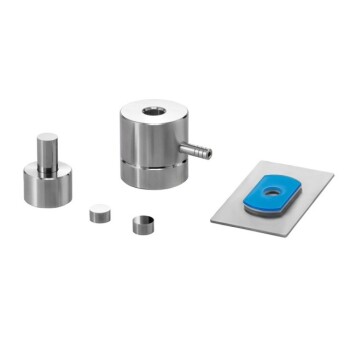
- Lab Infrared Press Mold
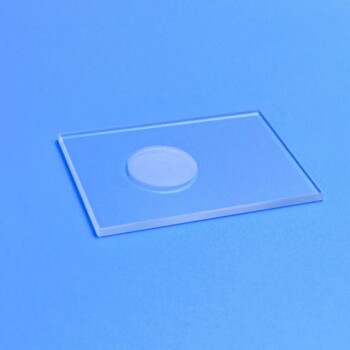
- XRD Sample Holder X-ray Diffractometer Powder Slide
- Infrared Thermal Imaging Temperature Measurement Double-Sided Coated Germanium Ge Lens
- No Demolding Lab Infrared Press Mold for Laboratory Applications
People Also Ask
- What are the different types of sampling techniques used in IR spectroscopy? A Guide to KBr, Mull, and ATR Methods
- Can you see mold with an infrared camera? How Thermal Imaging Reveals Hidden Moisture Problems
- What are the basic components of an IR spectrometer? A Guide to the Core Parts of FTIR Instruments
- What is the most commonly used in semiconductors? Discover Why Silicon Dominates Modern Electronics
- What are the properties of SiC? Unlock High-Temperature, High-Frequency Performance