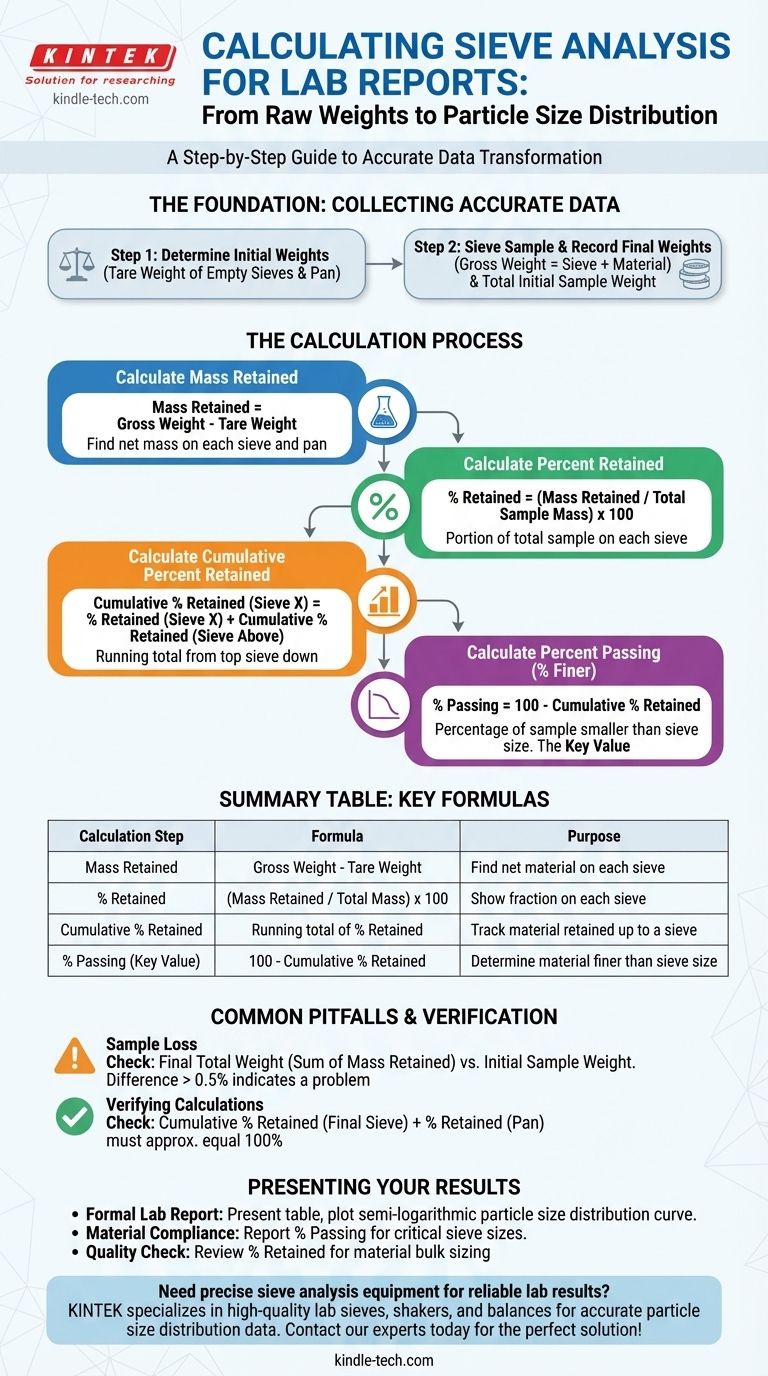
To calculate sieve analysis results for a lab report, you methodically convert the raw weight of material on each sieve into a series of percentages. This process involves finding the mass retained on each sieve, calculating its percentage relative to the total sample, and then determining the cumulative percentage of material that passes through each screen.
The core task of sieve analysis calculation is to transform raw mass measurements into a standardized format—the cumulative percent passing. This value is essential for creating a particle size distribution curve, which is the ultimate goal of the analysis.

The Foundation: Collecting Accurate Data
Before any calculation can begin, you must have precise measurements from the lab. The quality of your results is entirely dependent on the quality of this initial data.
Step 1: Determine Initial Weights
Before adding any sample material, you must weigh each individual sieve and the bottom pan. This is the tare weight.
Recording these empty weights accurately is critical for the calculations that follow.
Step 2: Sieve the Sample and Record Final Weights
After sieving your material for the specified time, you must weigh each sieve again, this time with the retained material inside. This is the gross weight.
You also need to know the total initial weight of the dry sample you started with before it was placed in the top sieve.
The Calculation Process: From Mass to Percentage
With your raw data collected, you can proceed with the calculations. This is typically organized in a data table with columns for each step.
Step 1: Calculate the Mass Retained
For each sieve, subtract the tare weight (empty sieve) from the gross weight (sieve + sample). This gives you the net mass of material retained on that specific sieve.
Mass Retained = Gross Weight - Tare Weight
The mass collected in the bottom pan should also be calculated this way.
Step 2: Calculate the Percent Retained
Next, divide the mass retained on each sieve by the total initial sample mass. Multiply the result by 100 to get the percentage.
% Retained = (Mass Retained / Total Sample Mass) x 100
This shows you what portion of the total sample was caught by each individual sieve.
Step 3: Calculate the Cumulative Percent Retained
This is a running total. Start with the percent retained on the largest sieve (the top one). Then, for each subsequent sieve, add its percent retained to the cumulative total of the sieves above it.
Cumulative % Retained (Sieve X) = % Retained (Sieve X) + Cumulative % Retained (Sieve above)
The final cumulative percent retained (which includes the pan) should be very close to 100%.
Step 4: Calculate the Percent Passing (% Finer)
This is the most important value for your final report and graph. It is the inverse of the cumulative percent retained.
% Passing = 100 - Cumulative % Retained
This value tells you what percentage of the entire sample is smaller than the opening size of that specific sieve. The % Passing for the pan should be 0, as no material can pass through it.
Common Pitfalls and Verification
A perfect analysis is rare. Understanding potential sources of error is key to producing a credible report.
The Problem of Sample Loss
It's common to lose a small amount of material (as dust, for instance) during the sieving process.
To check this, sum the individual masses retained on every sieve and the pan. Compare this final total weight to your initial sample weight. A difference of more than 0.5% may indicate a problem with the test procedure or data collection.
Verifying Your Calculations
The cumulative percent retained on your final sieve before the pan, plus the percent retained in the pan itself, must equal 100% (or be very close, accounting for minor sample loss).
If these numbers do not add up, there is an error in your calculation that must be found and corrected.
Presenting Your Results for a Report
The final step is to present your findings clearly. The goal is to make the particle size distribution immediately understandable.
- If your primary focus is a formal lab report: Present your calculations in a clear table and use the "% Passing" column to plot a semi-logarithmic particle size distribution curve.
- If your primary focus is material compliance: You may only need to report the "% Passing" for one or two critical sieve sizes specified by a project standard.
- If your primary focus is a quick quality check: A simple review of the "% Retained" column can quickly tell you where the bulk of your material is sized.
Ultimately, these calculations turn a pile of aggregates into precise data that defines the material's character.
Summary Table:
| Calculation Step | Formula | Purpose |
|---|---|---|
| Mass Retained | Gross Weight - Tare Weight | Find net material on each sieve |
| % Retained | (Mass Retained / Total Mass) x 100 | Show fraction on each sieve |
| Cumulative % Retained | Running total of % Retained | Track material retained up to a sieve |
| % Passing (Key Value) | 100 - Cumulative % Retained | Determine material finer than sieve size |
Need precise sieve analysis equipment for reliable lab results? KINTEK specializes in high-quality lab sieves, shakers, and balances that ensure accurate particle size distribution data. Our equipment is trusted by laboratories for its durability and precision, helping you avoid calculation errors from sample loss or inconsistent sieving. Contact our experts today to find the perfect sieve analysis solution for your lab's needs!
Visual Guide
Related Products
- Laboratory Test Sieves and Vibratory Sieve Shaker Machine
- Three-dimensional electromagnetic sieving instrument
- Laboratory Vibratory Sieve Shaker Machine for Dry and Wet Three-Dimensional Sieving
- Laboratory Vibratory Sieve Shaker Machine Slap Vibrating Sieve
- Laboratory Wet Three-Dimensional Vibratory Sieve Shaker Machine
People Also Ask
- What are the different methods of sieving? Choose the Right Technique for Your Material
- What size are test sieves? A Guide to Frame Diameters and Mesh Sizes
- What is the operating procedure of a sieve shaker? Master Accurate Particle Size Analysis
- What are the disadvantages of sieve machine? Key Limitations in Particle Size Analysis
- Can sieving be used to separate a solid substance from a liquid substance? Learn the Right Technique for Your Mixture