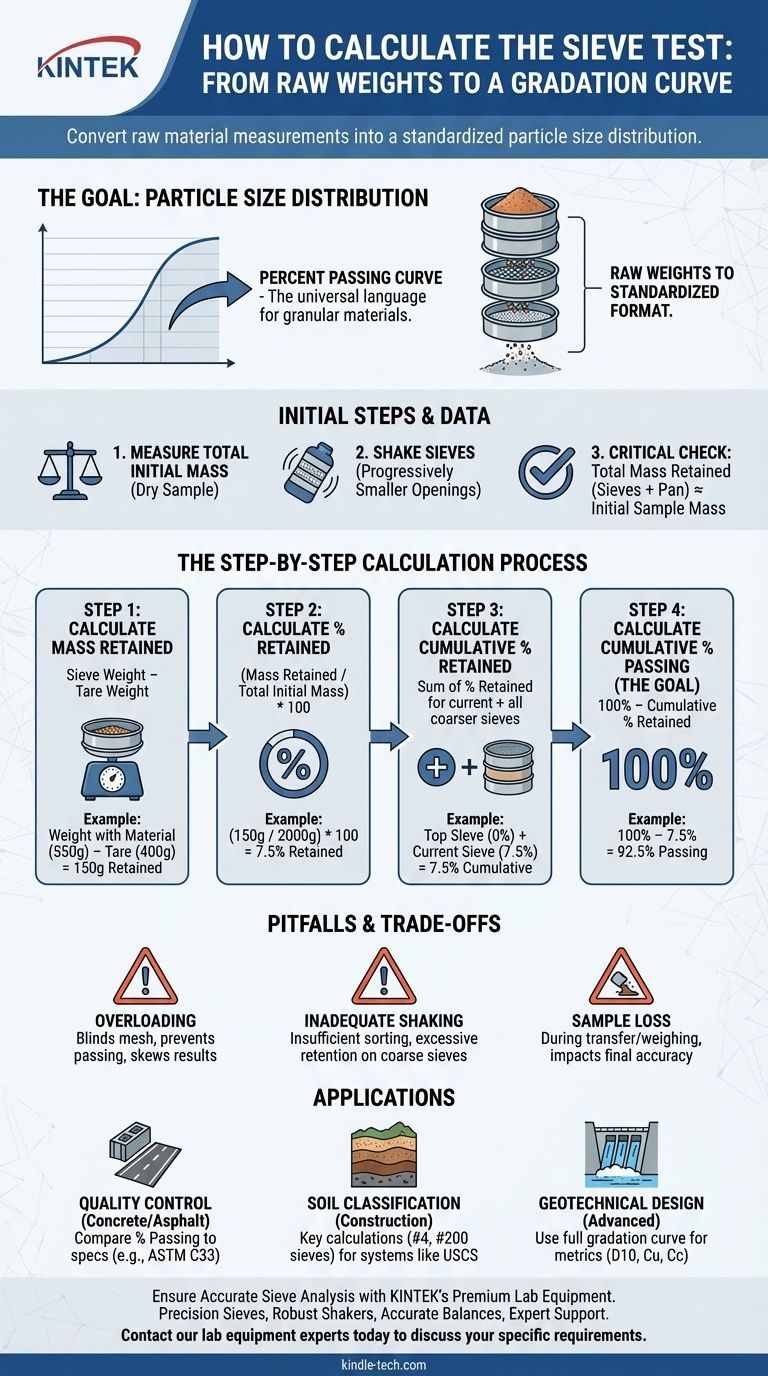
In essence, calculating a sieve test is a process of converting the raw weight of material retained on a series of stacked screens into a standardized format. This involves finding the percentage of the total sample that is retained by each sieve and, most importantly, calculating the cumulative percentage of material that passes through each one.
The core purpose of sieve test calculations is to transform raw mass measurements into a particle size distribution curve. This curve, expressed as "Percent Passing," is the universal language for understanding and specifying the character of granular materials like soil and aggregate.
The Goal: From Raw Weights to a Gradation Curve
A sieve analysis, or gradation test, determines the proportion of different particle sizes within a given sample. The calculation is the final step in a process that begins with careful measurement and mechanical sorting.
The Sieve Stack and Initial Data
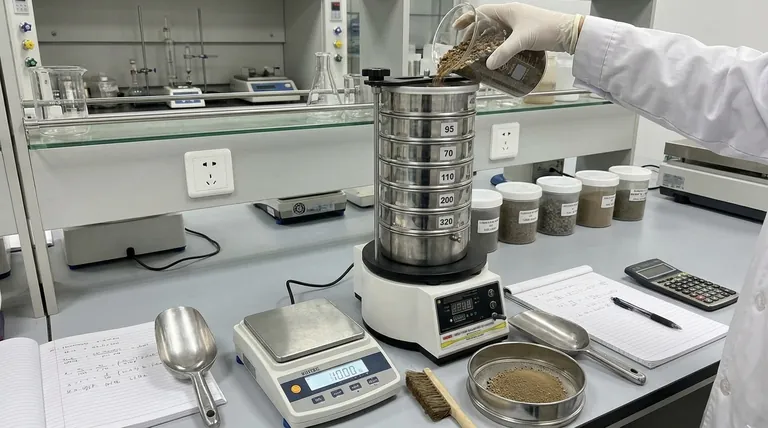
Before any calculation, the material is shaken through a stack of sieves with progressively smaller openings from top to bottom.
The essential data you must record are the total initial mass of the dry sample and the mass of material retained on each individual sieve, including the solid pan at the very bottom which catches the finest particles.
Verifying Your Measurements
A critical first check is to sum the masses retained on all sieves plus the pan. This total should be very close to the initial sample mass. A difference of more than a few percentage points may indicate a procedural error or sample loss.
The Step-by-Step Calculation Process
The goal is to populate a table that ultimately shows the cumulative percentage passing each sieve size. Follow these four steps for each sieve in your stack, starting from the top (largest opening).
Step 1: Calculate Mass Retained
This is the most direct measurement. It is simply the weight of the material left on each sieve after shaking is complete.
For example, if the weight of your #4 sieve with material is 550g and its empty (tare) weight is 400g, the mass retained is 150g.
Step 2: Calculate Percentage Retained
This converts the individual mass on each sieve into a percentage of the whole sample.
The formula is: (% Retained) = (Mass Retained on Sieve / Total Initial Sample Mass) * 100
Using our example with a total sample mass of 2000g: (150g / 2000g) * 100 = 7.5%. This means the #4 sieve retained 7.5% of the total material.
Step 3: Calculate Cumulative Percentage Retained
This is a running total. For any given sieve, you add its Percentage Retained to the sum of all percentages retained on the sieves above it.
The top sieve's cumulative percentage retained is simply its own percentage retained. For every sieve below, you add its individual percentage to the cumulative value of the sieve directly above it.
Step 4: Calculate Cumulative Percentage Passing
This is the final and most important value. It tells you what percentage of the entire sample is smaller than the current sieve size.
The formula is straightforward: (% Passing) = 100% - (Cumulative % Retained)
If the cumulative percentage retained on the #4 sieve is 7.5%, then the cumulative percentage passing is 100% - 7.5% = 92.5%. This result means 92.5% of the sample consists of particles small enough to pass through the #4 sieve.
Understanding the Trade-offs and Pitfalls
Accurate calculations depend entirely on accurate physical testing. Misleading results are often traced back to procedural errors, not mathematical ones.
The Risk of Overloading
Piling too much material onto the sieves is a common mistake. This "blinds" the mesh, preventing smaller particles from having a chance to pass through and artificially increasing the measured retained weight on coarser sieves.
Inadequate Shaking
Insufficient shaking time or energy means the particles are not adequately sorted. This often results in an excessive amount of material being retained on the upper sieves and not enough on the lower ones, skewing the entire distribution.
Sample Loss During Transfer
Losing material, especially fine dust, during weighing and transferring can significantly impact the results. This is why comparing the final total weight to the initial weight is a critical quality control check.
How to Apply This to Your Project
The final "Percent Passing" values are used to plot a gradation curve and classify the material for its intended engineering purpose.
- If your primary focus is quality control for concrete or asphalt: You will compare your calculated "Percent Passing" values against the specified upper and lower limits defined in project standards (e.g., ASTM C33).
- If your primary focus is soil classification for construction: The key calculations are the percentages passing the #4 and #200 sieves, as these values determine whether a soil is primarily gravel, sand, or fines according to systems like the USCS.
- If your primary focus is advanced geotechnical design (e.g., filters or drainage): You will use the full gradation curve to determine key metrics like D10, D30, and D60, which are then used to calculate coefficients of uniformity (Cu) and curvature (Cc) to assess material performance.
By correctly performing these calculations, you transform a simple sample of aggregate into a predictable and reliable engineering material.
Summary Table:
| Calculation Step | Formula | Purpose |
|---|---|---|
| Mass Retained | Sieve Weight - Tare Weight | Find material weight on each sieve |
| % Retained | (Mass Retained / Total Sample Mass) * 100 | Convert to percentage of total sample |
| Cumulative % Retained | Sum of % Retained for current and all coarser sieves | Running total of material retained |
| % Passing | 100% - Cumulative % Retained | Key result: percentage finer than sieve size |
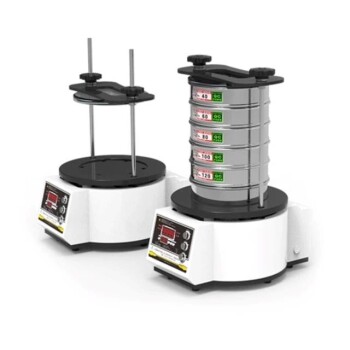
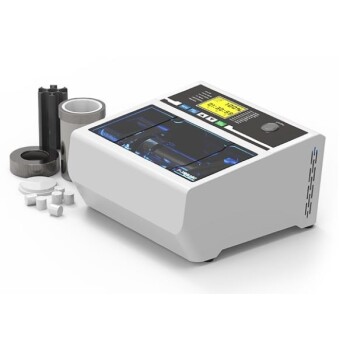
Ensure Accurate Sieve Analysis with KINTEK's Premium Lab Equipment
Accurate sieve test calculations start with reliable equipment. KINTEK specializes in high-quality sieves, shakers, and lab balances that deliver precise, repeatable results for your soil and aggregate testing needs.
Why choose KINTEK for your particle analysis?
- Precision Sieves: Manufactured to ASTM/ISO standards for consistent mesh openings
- Robust Shakers: Ensure proper particle separation and prevent blinding
- Accurate Balances: Critical for reliable mass measurements
- Expert Support: Technical guidance for your specific application (concrete QC, soil classification, geotechnical design)
Ready to improve your gradation testing accuracy? Contact our lab equipment experts today to discuss your specific requirements and get a personalized solution recommendation.
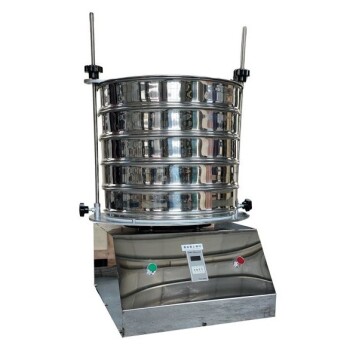
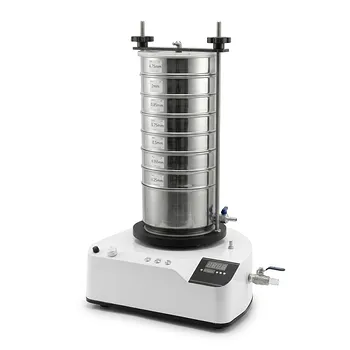
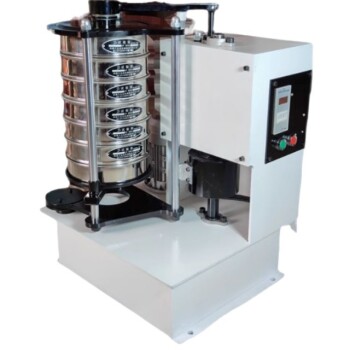
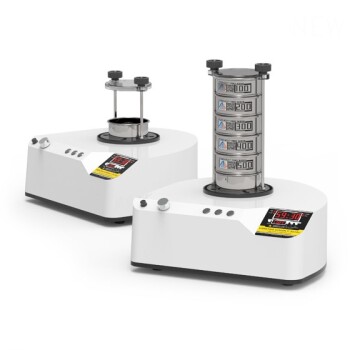
Visual Guide
Related Products
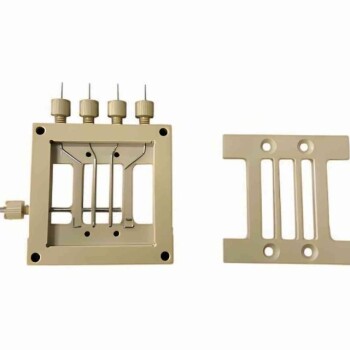
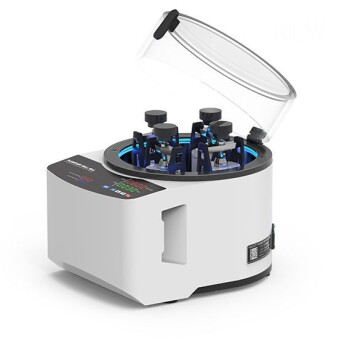
- Laboratory Test Sieves and Sieving Machines
- Laboratory Test Sieves and Vibratory Sieve Shaker Machine
- Laboratory Vibratory Sieve Shaker Machine for Dry and Wet Three-Dimensional Sieving
- Laboratory Vibratory Sieve Shaker Machine Slap Vibrating Sieve
- Three-dimensional electromagnetic sieving instrument
People Also Ask
- What are laboratory sieves used for? Measure Particle Size for Quality Control & R&D
- What materials are required for sieving? Achieve Accurate Particle Size Analysis
- What is the use of sieving in laboratory? Ensure Material Quality & Accurate Particle Analysis
- What is the difference between ASTM standards sieves and is standard sieves? Ensure Compliance for Your Lab
- What are the specifications for test sieves? A Guide to ASTM & ISO Standards for Accurate Particle Analysis