In principle, the melting point of a pure substance is a fixed physical constant. However, in the real world, the observed temperature at which a substance melts can absolutely change. This is not an arbitrary shift; it is a predictable response to two primary factors: changes in ambient pressure and the introduction of impurities into the substance.
While textbooks often present melting point as a static number, it is more accurately understood as a property that is constant only under a specific set of conditions. Understanding how pressure and purity influence this property is the key to predicting and controlling its behavior in any real-world application.
The Two Factors That Alter Melting Point
The "official" melting point of a substance, like water at 0°C (32°F), is measured under standard conditions—typically at one atmosphere of pressure and with the substance in a highly pure state. When these conditions are not met, the melting point will deviate.
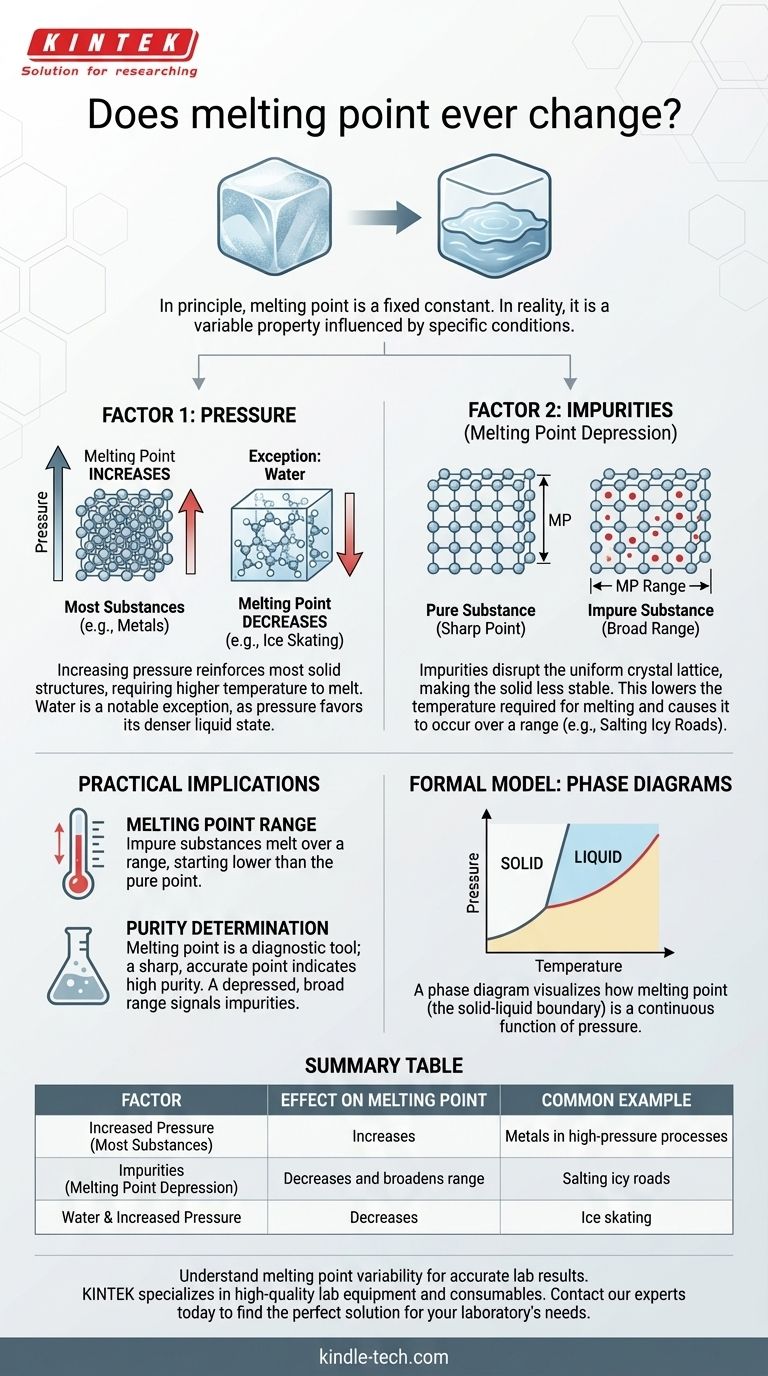
Factor 1: The Influence of Pressure
For most substances, increasing the external pressure forces the molecules into a more tightly packed arrangement. This reinforces the solid structure, requiring more energy (a higher temperature) to break the bonds and transition into a liquid.
Therefore, for the vast majority of materials, an increase in pressure leads to an increase in melting point.
There is, however, a critical and famous exception: water. Solid water (ice) is less dense than liquid water, which is why icebergs float. Increasing pressure on ice favors the denser state—liquid water. This means that under higher pressure, ice melts at a lower temperature. This is why an ice skate's blade, by exerting high pressure on a thin line, can create a microscopic layer of water to glide on.
Factor 2: The Role of Impurities
This is the most common reason for a change in melting point outside of a high-pressure lab. When you introduce an impurity (a solute) into a pure substance (a solvent), it disrupts the uniform, repeating crystal lattice of the solid.
This disruption makes the solid structure less stable. As a result, less energy is needed to break it apart and turn it into a liquid. This phenomenon is known as melting point depression.
A classic example is salting icy roads. The salt mixes with the ice, lowering its melting point. This allows the ice to melt even when the ambient air temperature is still below the normal freezing point of water.
Understanding the Practical Implications
Recognizing that melting point can change is not just an academic exercise. It has significant consequences in scientific and industrial settings, where it is often used as a diagnostic tool.
From a "Point" to a "Range"
A pure crystalline solid typically melts at a very sharp, specific temperature. When you begin heating it, the temperature rises until it hits the melting point, where it holds steady until all the solid has turned to liquid.
An impure substance behaves differently. It doesn't melt at a single temperature but over a melting point range. The melting begins at a lower temperature than for the pure substance and completes at a temperature closer to, but still often below, the pure substance's melting point.
Using Melting Point to Determine Purity
This "flaw" is actually an incredibly useful feature. In a chemistry laboratory, one of the first and fastest ways to assess the purity of a synthesized crystalline compound is to measure its melting point.
If the compound melts over a wide range and at a temperature lower than the literature value, it is a clear sign that impurities are present and further purification is necessary. A sharp melting point that matches the established value is a strong indicator of high purity.
The Formal Model: Phase Diagrams
The relationship between pressure, temperature, and a substance's state (solid, liquid, gas) is formally captured in a phase diagram.
A Map of Physical States
A phase diagram is a graph with pressure on the y-axis and temperature on the x-axis. Lines on the graph delineate the boundaries where the substance transitions between different phases.
The Solid-Liquid Boundary
The line that separates the solid phase from the liquid phase on this diagram represents the melting point at every possible pressure. Viewing this chart makes it instantly clear that melting point is not a single number but a continuous function of pressure. This visual model unifies the concepts and proves that melting point is inherently variable.
Making the Right Choice for Your Goal
Your perspective on melting point should be dictated by your objective.
- If your primary focus is chemical synthesis or analysis: Treat melting point as a crucial diagnostic tool for purity. A sharp, accurate melting point confirms success, while a depressed, broad range signals the need for purification.
- If your primary focus is materials science or engineering: You must account for pressure variations in your designs. The melting point of a material at sea level may not be the same in a high-pressure industrial process or deep-earth application.
- If your primary focus is understanding everyday phenomena: Use the principle of melting point depression to explain why we salt roads in winter or why adding salt to an ice-water bath makes it colder for churning ice cream.
Ultimately, recognizing that melting point is a dynamic property, not a static number, transforms it from a simple fact into a powerful predictive tool.
Summary Table:
| Factor | Effect on Melting Point | Common Example |
|---|---|---|
| Increased Pressure | Increases (for most substances) | Metals in high-pressure processes |
| Impurities (Melting Point Depression) | Decreases and broadens range | Salting icy roads |
| Water & Increased Pressure | Decreases | Ice skating |
Need precise temperature control for your lab work?
Understanding melting point variability is critical for accurate synthesis and analysis. KINTEK specializes in high-quality lab equipment and consumables, including melting point apparatus, designed to deliver the reliability and precision your laboratory demands.
Let us help you achieve consistent, accurate results. Contact our experts today to find the perfect solution for your laboratory's needs.
Visual Guide