Yes, absolutely. While Fourier Transform Infrared (FTIR) spectroscopy is widely recognized for qualitative analysis—identifying the chemical makeup of a substance—it is also a powerful and established technique for quantitative analysis. The key is leveraging the direct relationship between the amount of light a sample absorbs and the concentration of the component of interest.
The ability to use FTIR for quantitative analysis is fundamentally based on the Beer-Lambert Law, which states that a component's concentration is directly proportional to its absorbance of infrared light at a specific frequency. Success, however, is not automatic; it depends entirely on careful method development and an understanding of the technique's limitations.
The Principle: How FTIR Measures "How Much"
The entire premise of quantitative FTIR rests on a simple physical law. Understanding this principle is the first step to developing a reliable method.
The Beer-Lambert Law
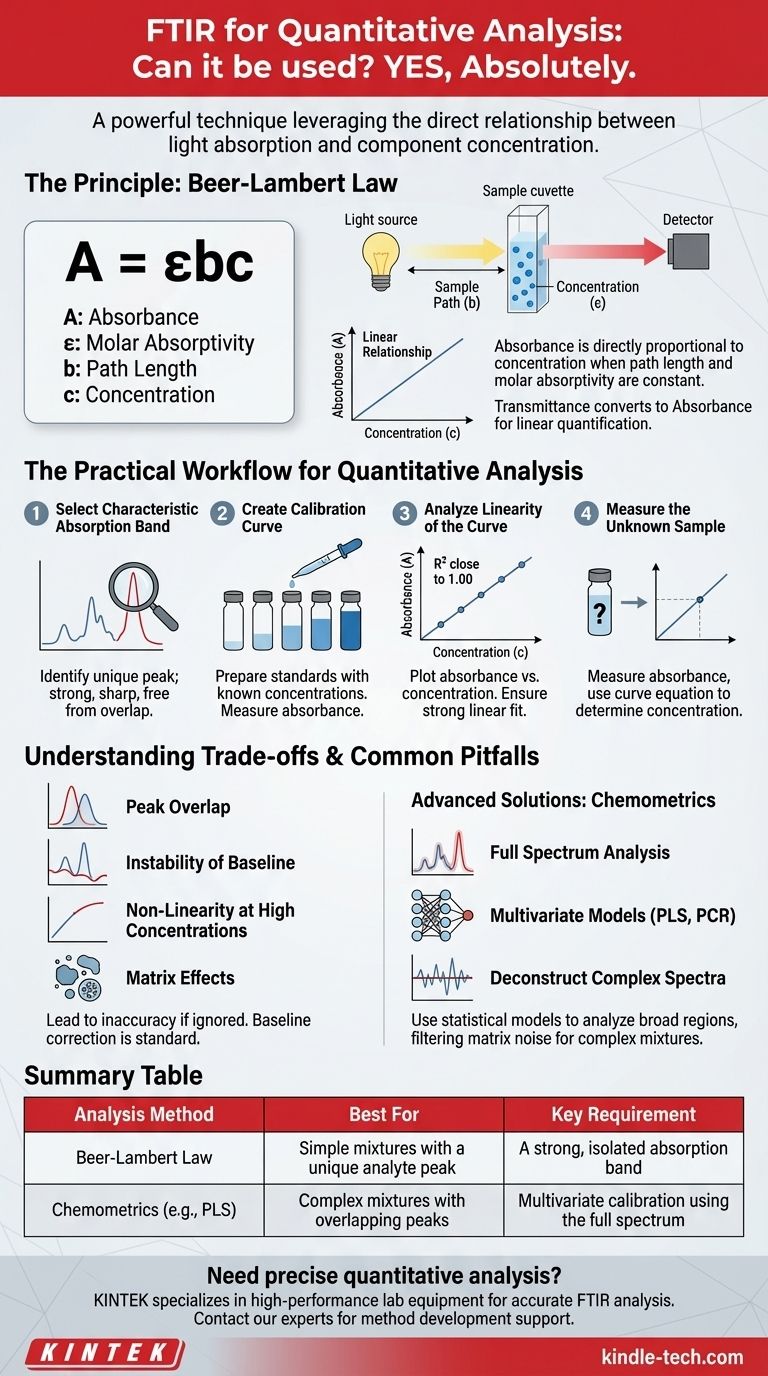
The Beer-Lambert Law is the theoretical foundation. It is expressed as A = εbc, where A is absorbance, ε is the molar absorptivity (a constant for a substance at a specific wavelength), b is the path length of the light through the sample, and c is the concentration.
In a controlled experiment, the path length (b) is kept constant, and the molar absorptivity (ε) is an inherent property of the molecule. This leaves a direct, linear relationship between absorbance (A) and concentration (c).
Why Absorbance is the Key Metric
FTIR detectors measure transmittance, or the amount of light that passes through a sample. However, transmittance has a logarithmic relationship with concentration, which is difficult to work with.
The instrument's software converts this transmittance measurement into absorbance, which provides the clean, linear relationship needed for straightforward quantification.
The Practical Workflow for Quantitative Analysis
A successful quantitative analysis follows a structured, multi-step process. Skipping any of these steps will compromise the accuracy of your results.
Step 1: Select a Characteristic Absorption Band
First, you must identify an absorption peak (or band) in the infrared spectrum that is unique to the analyte you want to measure. A good analytical band should be strong, sharp, and, most importantly, free from spectral overlap from other components in the sample matrix.
Step 2: Create a Calibration Curve
You cannot determine the concentration of an unknown from a single measurement. You must first build a model by preparing a series of calibration standards—samples with known, varying concentrations of your analyte.
Measure the absorbance of the selected peak for each standard. Then, plot the absorbance values on the y-axis against the known concentrations on the x-axis. This plot is your calibration curve.
Step 3: Analyze the Linearity of the Curve
For a robust method, the plotted points should form a straight line. The quality of this fit is often measured by the coefficient of determination (R²). An R² value close to 1.00 (e.g., >0.99) indicates a strong linear relationship and a reliable calibration model.
Step 4: Measure the Unknown Sample
Once you have a validated calibration curve, you can measure the absorbance of your unknown sample under the exact same experimental conditions. By finding that absorbance value on the y-axis of your curve, you can use the line equation to determine its corresponding concentration on the x-axis.
Understanding the Trade-offs and Common Pitfalls
While powerful, the Beer-Lambert law approach has limitations that can lead to inaccurate results if ignored.
The Problem of Peak Overlap
In complex mixtures, it is common for absorption bands from different components to overlap. If another substance absorbs light at the same frequency as your analyte, your measured absorbance will be artificially high, leading to an overestimation of the concentration.
Instability of the Baseline
A flat, stable baseline is critical. Drifting or inconsistent baselines, caused by factors like instrument noise, temperature fluctuations, or sample scattering, can introduce significant error into the peak height or area measurement. Baseline correction is a standard and necessary data processing step.
Non-Linearity at High Concentrations
The Beer-Lambert Law assumes molecules act independently. At very high concentrations, molecules can begin to interact, which can alter their ability to absorb light. This "real-world" chemical effect can cause the linear relationship to break down, making the calibration curve unreliable at its upper end.
Matrix Effects
The other components in a sample (the "matrix") can subtly influence the analyte's absorption spectrum. A calibration model built using the pure analyte in a simple solvent may not be accurate for measuring that same analyte in a complex matrix like blood, soil, or a product formulation.
Advanced Solutions for Complex Mixtures
When simple peak analysis fails due to the pitfalls above, more sophisticated chemometric methods are required.
Chemometrics: Using the Full Spectrum
Instead of relying on a single, isolated peak, chemometrics uses multivariate statistical models to analyze broad regions of the spectrum, or even the entire spectrum at once.
Techniques like Partial Least Squares (PLS) and Principal Component Regression (PCR) are powerful algorithms. They can deconstruct complex, overlapping spectra to find the underlying correlation between spectral changes and concentration changes, effectively filtering out noise and interferences from the sample matrix.
Making the Right Choice for Your Goal
To apply FTIR effectively for quantitative analysis, you must match the technique to the complexity of your problem.
- If your primary focus is a simple mixture with a unique analyte peak: The classic Beer-Lambert Law approach using a single-peak calibration curve is efficient and reliable.
- If your primary focus is a complex mixture with overlapping spectral features: A single-peak analysis will likely fail, and you must invest time in developing a multivariate chemometric model (e.g., PLS).
- If your primary focus is achieving the highest accuracy and reproducibility: You must rigorously control all experimental variables, including path length, temperature, and sample preparation, and always operate within the validated linear range of your calibration.
FTIR is a remarkably versatile tool, equally capable of answering "what is it?" and "how much is there?" when the proper analytical diligence is applied.
Summary Table:
| Analysis Method | Best For | Key Requirement |
|---|---|---|
| Beer-Lambert Law | Simple mixtures with a unique analyte peak | A strong, isolated absorption band |
| Chemometrics (e.g., PLS) | Complex mixtures with overlapping peaks | Multivariate calibration using the full spectrum |
Need precise quantitative analysis for your laboratory samples?
KINTEK specializes in providing high-performance lab equipment and consumables tailored for accurate FTIR analysis. Whether you're working with simple formulations or complex matrices, our solutions ensure reliable results and enhanced lab efficiency.
Contact our experts today to discuss how we can support your quantitative FTIR method development and meet your specific laboratory needs.
Visual Guide
Related Products
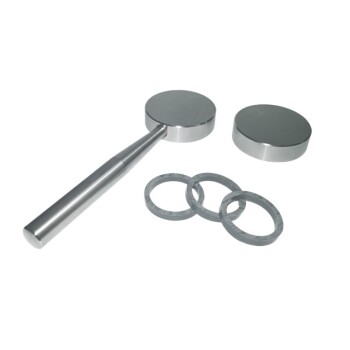
- XRF & KBR plastic ring lab Powder Pellet Pressing Mold for FTIR
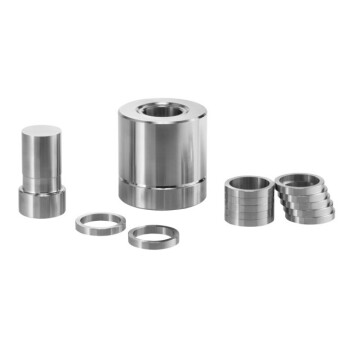
- XRF & KBR steel ring lab Powder Pellet Pressing Mold for FTIR
People Also Ask
- What is the purpose of using a mold for pellet pressing when preparing catalyst test samples? Ensure Data Consistency
- What is the purpose of using potassium bromide KBr in the FTIR measurement? Achieve Clear, Accurate Solid Sample Analysis
- How does the pressure control of a powder pellet press affect the quality of FSCC green bodies? Optimize Bonding
- What is the XRF pressed pellet method? A Fast, Cost-Effective Sample Prep Guide
- How does a laboratory powder pellet press facilitate the preparation of multi-layered gradient Al2O3/ZrO2 ceramic green bodies? Precision Bonding Techniques